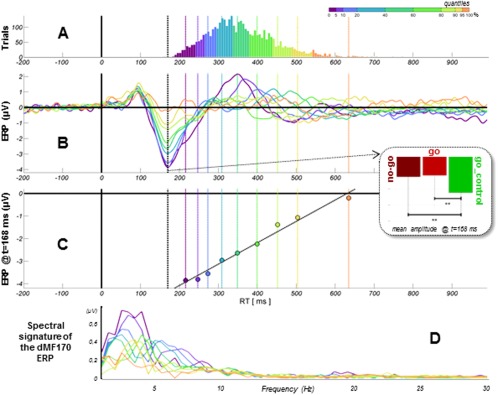
Figure 3.

Psychophysiological characteristics of the dMF170 component. (A) Cumulated distributions of RT (go and go_control trials merged for analysis). Data are Vincentized with unequal‐sized subsets to compensate for RT distribution inhomogeneity in order to better assess what accounts for these differences in RT (quantiles are displayed with color code). (B) Time series of dMF170 activity (back‐projected on electrode C23/Fcz) (t0 = target presentation). The component peaks negatively approximately 170 ms after stimulus presentation, identically for go and nogo trials (means), but shows larger amplitude for the go_control condition. The mean evoked potential is displayed for each quantile. (C) The mean evoked potential for each quantile is referred to the corresponding mean RT. The amplitude of the dMF170 closely predicts RT. (D) Fast Fourier transform of the dMF170 ERP.
