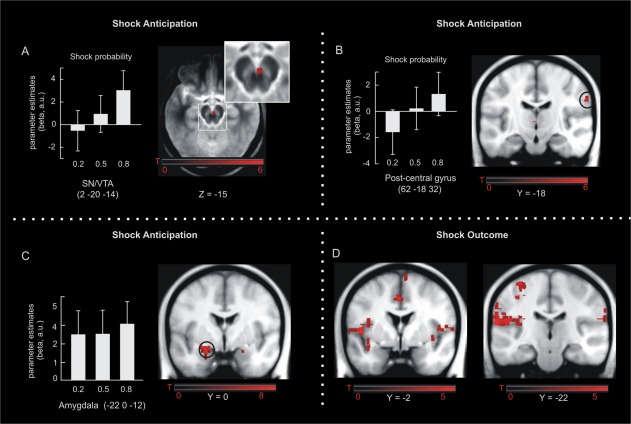
Figure 3.

fMRI results. Shock anticipation was associated with linear activity increases in the SN/VTA (A) and right post‐central gyrus (B). The amygdala responded to all three cues but its activity was not scaled according to their probability (C). Activity changes in response to shock delivery were observed in bilateral insula, anterior/middle cingulate cortex, and left post‐central gyrus (D). Maps of activations are superimposed on an MT group template (A) and on a T1 group template in (B‐D). Error‐bars denote one standard error of the mean. [Color figure can be viewed in the online issue, which is available at http://wileyonlinelibrary.com.]
