
Figure 3.
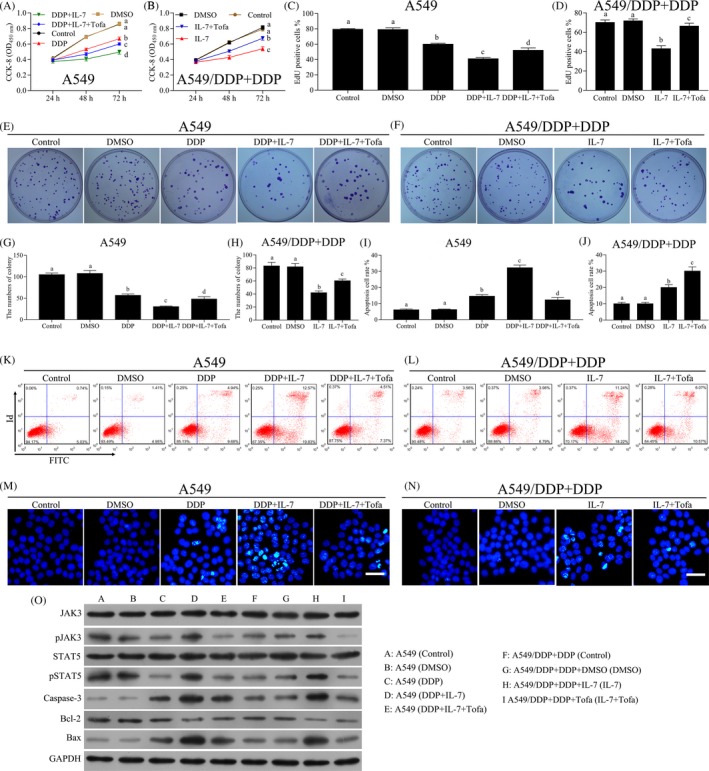
Tofacitinib inhibited the sensitivity of NSCLC cells by IL‐7. The A549 and A549/DDP cells were treated with DMSO, DDP, IL‐7(50 ng/mL) or tofacitinib (pre‐treated, 100 nmol/L) alone or combined as indicated in the figure for 24, 48 or 72 h. The concentration of cisplatin in A549 and A549/DDP cells was 1 and 5 μg/mL, respectively. A, B, Cell proliferation analysis using CCK‐8 assay was performed to assess the cell viability after indicated treatment. C, D, EdU proliferation assays were performed for A549 and A549/DDP cells after indicated treatment for 48 h, and the percentage of EdU‐positive cells was quantified. E‐H, Colony‐forming assay was performed to analyse the colony formation efficiency of A549 and A549/DDP cells after indicated treatment for 48 h. The average numbers of colony were counted. I‐L, The A549 and A549/DDP cells were treated with indicated treatment for 48 h, and the cell apoptosis was measured by flow cytometry. M, N, Cell apoptosis was evaluated using HOECHST 33342 assay. Representative images of different groups are showed. Scale bars, 20 µm. O, The levels of JAK3, p‐JAK3, STAT5, p‐STAT5, caspase‐3, Bcl‐2 and Bax in A549 and A549/DDP cells after indicated treatment for 48 h were analysed by Western blot. Data represent three independent experiments (average and s.e.m of triplicate samples). The lowercase letters (a, b, c, d) represent statistically significant (P < .05). To compare whether there is a significant difference, same letters marked were considered to have no significant difference between the two groups and different letters marked were considered to have significant difference between the two groups