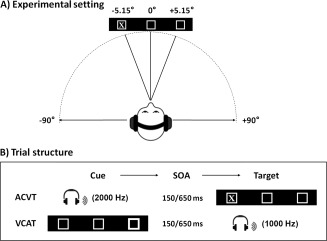
Figure 1.

This figure presents a cartoon representation of the basic experimental setting (A) as well as a representation of the trial structure (B) for the two cross‐modal orienting tasks: auditory cues with visual targets (ACVT) and visual cues with auditory targets (VCAT). The basic visual display consisted of a black background with two white boxes flanking a central fixation box. Auditory stimuli were delivered to the headphones at approximately 90° from the central meridian, whereas visual stimuli were delivered at a visual eccentricity of 5.15°. The stimulus onset asynchrony (SOA) between cues and targets was 150 or 650 ms.
