
Figure 2.
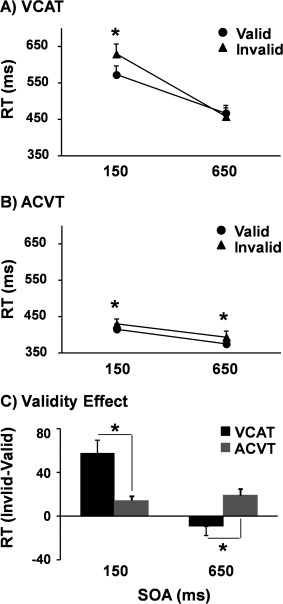
Graphs A and B show the reaction time (RT) in milliseconds (ms) for visual cues/auditory targets (VCAT: Panel A) and auditory cues/visual targets (ACVT: Panel B). In both panels, RT for valid (solid circle) and invalid (solid triangle) trials were plotted as a function of the stimulus onset asynchrony (SOA). Graph C depicts the validity effect score (RT: invalid–valid trials) for VCAT (black bars) and ACVT (gray bars) tasks at each SOA. Error bars correspond to the standard error of the mean. The asterisk (*) is used to denote a significant result.