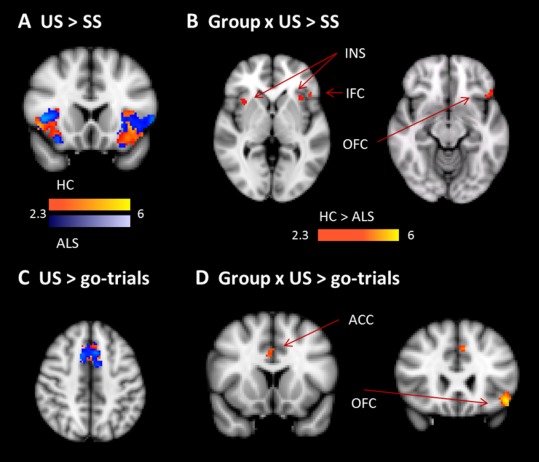
Figure 4.

Error monitoring. A shows the contrast of unsuccessful (US) relative to SS, separately for healthy controls (yellow–red) and ALS patients (blue). B shows the interaction of group and the contrast of US relative to SS. We found decreased activity in ALS patients in left inferior frontal cortex (IFC), bilateral insula (INS) and left orbitofrontal cortex (OFC). C shows the contrast of US relative to go‐trials, separately for controls (red) and patients (blue). D shows the interaction of group and the contrast of US relative to go‐trials. ALS patients showed reduced activity in right ACC and left OFC. [Color figure can be viewed in the online issue, which is available at http://wileyonlinelibrary.com.]
