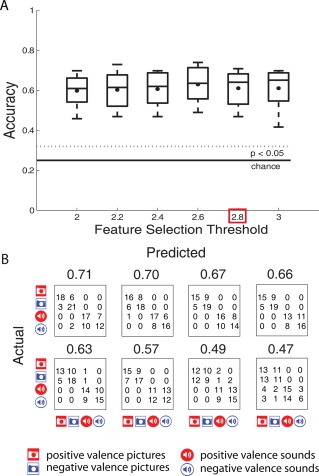
Figure 3.

(A) Four‐way classification accuracies across the 8 participants, summarized by box plots, are shown for different feature selection thresholds. (B) Confusion matrices and the corresponding classification accuracies for the 8 participants, ordered by classification accuracies, are shown for 2.8 feature selection threshold. [Color figure can be viewed in the online issue, which is available at http://wileyonlinelibrary.com.]
