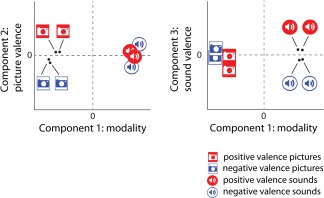
Figure 5.

Positive and negative valence for picture and sound stimuli in the space defined by the first three principal components of the compromise matrix. Component one accounts for 92.76% of the variability in the data and contrasts visual and auditory stimuli. Component two accounts for 2.22% of the variability in the data and contrasts positive and negative valence for picture stimuli. Component three accounts for 1.43% of the variability in the data and contrasts positive and negative valence for sound stimuli. Lines are used to label points in close proximity. [Color figure can be viewed in the online issue, which is available at http://wileyonlinelibrary.com.]
