
Figure 1.
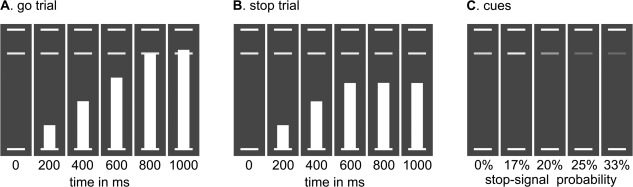
Stop‐signal anticipation task. Three horizontal lines formed the background displayed continuously during the task. A: In each trial, a bar moved at constant speed from the bottom up, reaching the middle line in 800 ms. The main task was to stop the bar as close to the middle line as possible by pressing a button with the right thumb. In other words, the target response time was 800 ms. These trials are referred to as go trials. B: In a minority of trials, the bar stopped moving automatically before reaching the middle line (i.e., the stop‐signal), indicating that a response had to be withheld. These trials are referred to as stop trials. C: The probability that a stop‐signal would occur was manipulated across trials and was indicated by the color of the target response line. There were five stop‐signal probability levels: 0% (green); 17% (yellow); 20% (amber); 25% (orange); and 33% (red).