
Figure 2.
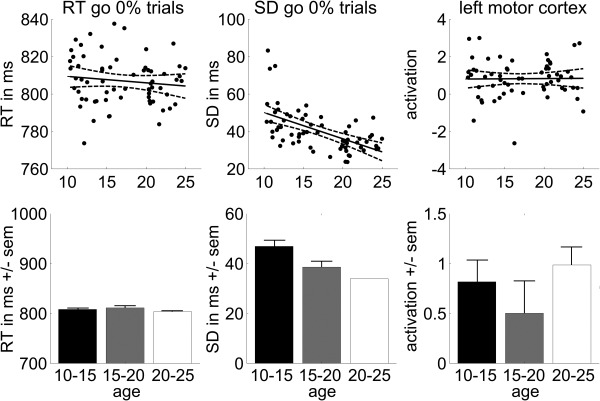
Basic response execution. Scatter plots of reaction times (RT), standard deviations (SD), and left motor cortex activation for go trials with a 0% stop‐signal probability as a function of age (with linear trend line and 95% confidence interval), and bar plots with averages for the three age groups (± standard error of the mean).