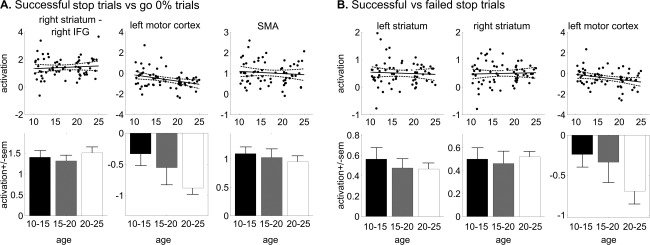
Figure 4.

Reactive inhibition activation data. Scatter plots of brain activation (regression coefficients) as a function of age (with linear trend line and 95% confidence interval), and bar plots with averages for the three age groups (± standard error of the mean). Abbreviations: IFG, inferior frontal gyrus; SMA, supplementary motor area.
