
Figure 2.
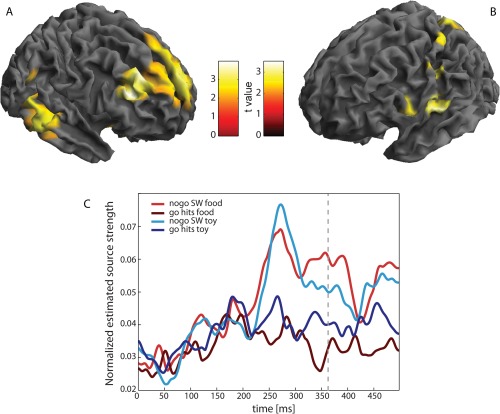
Evoked field analysis on source level. A and B show the main effect of go‐nogo for the period 0–500 ms. A Areas with stronger activity for successful withholds (SW); B Areas with stronger activity for hits. Cortical activity was rendered onto the surface of a standard anatomical brain volume (Montreal Neurological Institute). For display, significance threshold was lowered to P < 0.01 (uncorrected). C Time courses of activity of voxels surrounding the peak voxel of the most significant cluster for the contrast successful withholds versus hits (rDLPFC). Time courses are shown as mean over all subjects separately for all conditions. Dashed line: mean reaction time of hits. [Color figure can be viewed in the online issue, which is available at http://wileyonlinelibrary.com.]