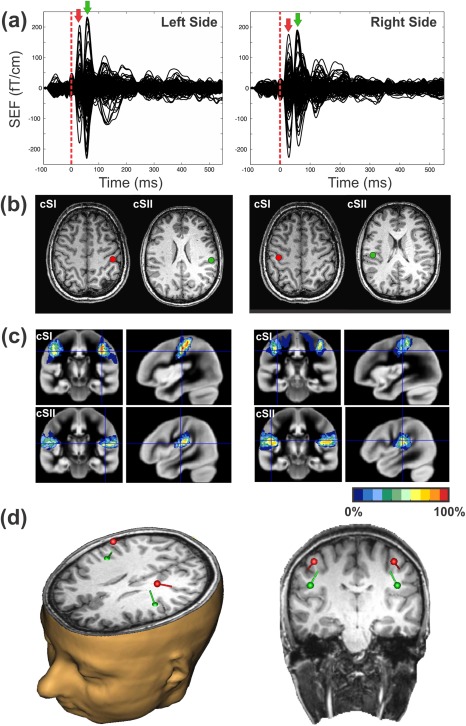
Figure 4.

Schematic representation of the ECD approach used to define the four ROIs in the contra‐ and ipsi‐lateral S1 and S2. (a) SEFs for the single finger stimulation (150 trials) of the left (left panel) and right (right panel) index and middle fingers respectively. Red and green arrows indicate the latencies at which the ECDs were estimated. (b) The corresponding ECDs located at SI and SII for the left (left panel) and right (right panel) stimulation sides fitted at the peak of the first and second SEF components. MRI slides are in neurological orientation. (c) The correspondence of the two ECDs with the underlying cytoachitectonic maps (Eickoff et al., 2006). Red and green ECDs are overlaid on BA3b and OP1 maps respectively. (d) 3D representation of the four ECDs locations with respect to the participant's anatomical scan.
