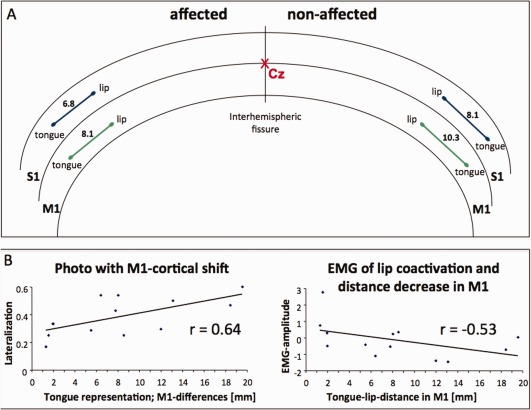
Figure 2.

A: Schematic overview of the averaged results of the fMRI evaluation of representation sites (COG within S1 and M1) of the lip and the tongue in the nonaffected and the affected hemisphere. The tongue–lip distance was smaller in the affected hemisphere than in the nonaffected hemisphere (S1 = 6.8 < 8.1mm; M1 = 8.1 < 10.3 mm). The crossing of the interhemispheric fissure and the central sulcus is indicated with Cz. B: Correlation plots between fMRI representation in the precentral gyrus and clinical data (photo documentation of labial symmetry during lip elevation and labial EMG amplitude during tongue movements). Left: The more symmetrical the lip elevation in comparison with the affected and nonaffected side (less lateralization), the nearer the representation of the tongue to the lip. Right: The closer the representation site of the lip to that of the tongue in the precentral gyrus of the affected hemisphere, the higher the lip coactivation (orbicular EMG) during tongue movements. [Color figure can be viewed in the online issue, which is available at http://wileyonlinelibrary.com.]
