Figure 1.

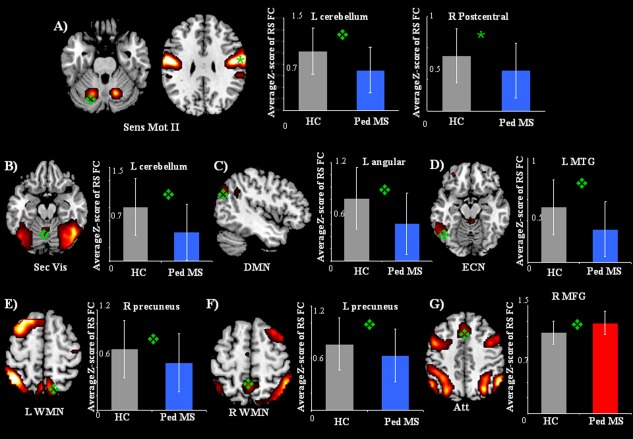
Illustrative examples of the spatial patterns of RS FC from healthy controls and pediatric MS patients (P < 0.05, family‐wise error corrected) and bar plots showing average Z‐scores and standard deviations of each significant cluster of between‐group difference. (A) Sensorimotor network II; (B) secondary visual network; (C) DMN; (D) ECN; (E) left (L) WMN; (F) right (R) WMN; (G) frontoparietal attention network. Blue bars represent clusters of decreased RS FC in pediatric MS patients versus controls, and red bars represent clusters of increased RS FC in pediatric MS patients versus controls. Abbreviations: L, left; R, right; MTG, middle temporal gyrus; MFG, medial frontal gyrus.
