Abstract
Constructing an atlas from a population of brain images is of vital importance to medical image analysis. Especially in neuroscience study, creating a brain atlas is useful for intra‐ and inter‐population comparison. Research on brain atlas construction has attracted great attention in recent years, but the research on pediatric population is still limited, mainly due to the limited availability and the relatively low quality of pediatric magnetic resonance brain images. This article is targeted at creating a high quality representative brain atlas for Chinese pediatric population. To achieve this goal, we have designed a set of preprocessing procedures to improve the image quality and developed an intensity and sulci landmark combined groupwise registration method to align the population of images for atlas construction. As demonstrated in experiments, the newly constructed atlas can better represent the size and shape of brains of Chinese pediatric population, and show better performance in Chinese pediatric brain image analysis compared with other standard atlases. Hum Brain Mapp 35:3880–3892, 2014. © 2014 Wiley Periodicals, Inc.
Keywords: atlas construction, image registration, pediatric population, magnetic resonance image
INTRODUCTION
Brain magnetic resonance imaging (MRI) plays an important role in neurological disease diagnosis and neuroscience study. In neuroscience study, to compare the structural and functional difference in brains of different groups [Bai et al., 2012; Gerber et al., 2010; Nitsche et al., 2004; Tang et al., 2010; Toga et al., 2003] and study the development of human brain [Gerber et al., 2010; Giedd et al., 1996, 1999; Gogtay et al., 2002; Lenroot and Giedd, 2006], one important step is to construct a brain template or atlas. Brain atlas, generated either from a single subject or from multiple subjects, can provide a population‐specific baseline from which to investigate population deviations. A more complete multipopulation understanding of brain development is essential in the detection of early vulnerability and the delivery of appropriate intervention.
An early standard atlas is the Talairach and Tournoux atlas [Talairach and Tournoux, 1988], which was created based upon the postmortem sections of a 60‐year‐old French female who had a smaller than average brain size. It provides a standard brain coordinate system reference, but using it as atlas means that most individual brains must be considerably warped to fit the small size of the atlas, inducing some error. Later, with continuing progress achieved in medical imaging field, more advanced techniques have been used in atlas construction. Population‐based atlas, which defines a more representative brain of the population, has become more acceptable. Based on different populations and using different atlas construction techniques, many atlases have been created, such as the MNI305 atlas [Collins et al., 1994] (by averaging 305 young normal subjects' MR images), ICBM152 [Mazziotta et al., 1995] (the average of 152 normal MRI scans that have been matched to the MNI305 using a 9 parameter affine transform), Colin27 [Holmes et al., 1998] (one subject scanned 27 times, co‐registered and averaged to create a very high detail MRI dataset of one brain). In recent years, to achieve more anatomical details in atlas image, rather than linear registration, more complicated nonlinear registration has been applied to transform each scan. With a group of brain images, the atlas is built by registering the population of subjects into one common space. The early representative work in this category is the congealing registration method proposed in Learned‐Miller [2006]. An objective function based on the pixel stack entropy is defined over all aligned images in the dataset, to solve the groupwise registration problem by a gradient‐based stochastic optimizer. The congealing registration method has been extended by Balci et al. [2007] and Zöllei et al. [2005] to perform non‐rigid registration, by Wang et al. [2010] to use the attribute vector for guiding the registration and achieving more robust and accurate registration results. Another popular atlas construction by groupwise registration was proposed by Joshi et al. [2004]. The groupwise registration is implemented by iteratively constructing the group mean image and estimating the transformation fields of all subjects towards the estimated tentative group mean image. Several follow‐up studies such as [Fletcher et al., 2009; Jia et al., 2010; Wu et al., 2011] have been proposed in recent years to improve Joshi's work and solve the problem of fuzzy group mean image.
The human brain is highly variable among individuals and different groups (e.g., population with different ages, genders, and races), thus a brain atlas is a population specific image, which can serve as a useful tool for inter‐population comparison. Meanwhile, to study one population, it is better to construct the population‐specific atlas. In this study, we mainly focus on Chinese pediatric population. To the best of our knowledge, there are several works studying Chinese brain atlas construction [Tang et al., 2010; Wang et al., 2013], but this is still the first attempt to construct a high quality brain atlas for Chinese pediatric population. Substantial morphological changes occurring during early development of brain render the use of an adult brain atlas for analyzing pediatric data may introduce some errors and bias. Currently, increasing attention has been attracted in pediatric studies. Wilke et al. [2003] studied 200 healthy children with the age range of 5–18 years. They also suggested that caution should be used when analyzing pediatric brain data using adult a priori information. Fonov et al. [2011] created T1‐weighted, T2‐weighted, and proton density‐weighted atlases for 4.5–18.5 years old children. Bhatia et al. [2007] used an expectation‐maximization framework to build an MRI atlas for 1‐ and 2‐year olds. Shi et al. [2011] collected a longitudinal dataset involving 95 normal infants at three ages: neonate, 1‐year‐old, and 2‐year‐old, and obtained age‐specific atlases for each age group. All the above pediatric studies are based on Western populations. However, the anatomical differences between Western and Eastern populations provide great variation, with fundamental genetic and environmental disparities resulting in overall and regional differences in brain shape, size, and volume [Lee et al., 2005; Tang et al., 2010]. Additionally, most of current studies for pediatric brain atlas construction adopt similar procedures with the adult brain atlas construction. But as indicated in Fonov et al. [2011] and Shi et al. [2011], the image quality has considerable difference between child brain scans and adult brain scans, it is necessary to take a unique set of procedures for child brain image processing to achieve higher accuracy.
In this article, we propose a set of procedures to create an MRI brain atlas for Chinese pediatric population. Some specially designed preprocessing steps were implemented to improve the quality of child MR brain images. A new intensity and sulci landmark combined groupwise registration method was proposed to continually improve the quality of constructed atlas. The final constructed atlas was compared with other standard atlases in different aspects and showed its superiority in handling Chinese pediatric brain data. The experimental results have demonstrated the necessity of creating the atlas for the specific Chinese pediatric population. To our knowledge, this is the first high quality MRI brain atlas constructed for Chinese pediatric population. In addition, the proposed atlas construction method is also novel for handling brain MR images of children, which can also be adapted for analyzing other brain images of pediatric population.
MATERIALS AND METHODS
Subjects and Image Requisition
The anatomical data were collected from 53 normal Chinese children volunteers, age ranged from 5.93 to 8.01 years (6.98 ± 0.49 years). These subjects were consisted of 26 females and 27 males, 52 of which were righted‐handed. None of the subjects has any history of neurological, psychiatric, or significant medical illness. T1‐weighted brain images were acquired in the sagittal plane with a Phillips Achieva 1.5 T MRI scanner with an eight‐channel SENSE head coil. A 3D FFE sequence was applied with following parameters: 150 slices, TR/TE = 25/4.6 ms, flip angle = 15°, FOV = 256 × 256 mm2, matrix size =256 × 256, voxel size = 1 × 1 × 1 mm3.
Preprocessing
Before atlas construction, MR images need to go through some preprocessing procedures to improve the image quality. For normal adult MR brain images, the preprocessing steps usually include intensity normalization, bias field correction, and brain extraction. To handle child brain MRI scans, some special techniques are required, as the quality of child brain MR images are relatively lower than adult brain MR images. The main reason for the low quality is the difficulty during image acquisition and the inherent property of child brain structures. It is relatively harder for children to stay still during the whole image acquisition process. The movement of subjects will introduce some noise and image artifacts in the obtained images. It can be obviously seen in Figure 1a that noise to signal level is high and there exist some motion artifacts resulting from the movement of imaging subjects. Another major issue impacting the quality of child brain MR image is the low tissue contrast, as the development of brain structures is still in a primary stage, and myelination is still incomplete. These factors, that is, low signal‐to‐noise ratio, motion artifacts, low tissue contrast, will greatly undermine the performance of subsequent processing. Therefore, we use three steps to preprocess child brain MR images to improve the image quality.
Figure 1.
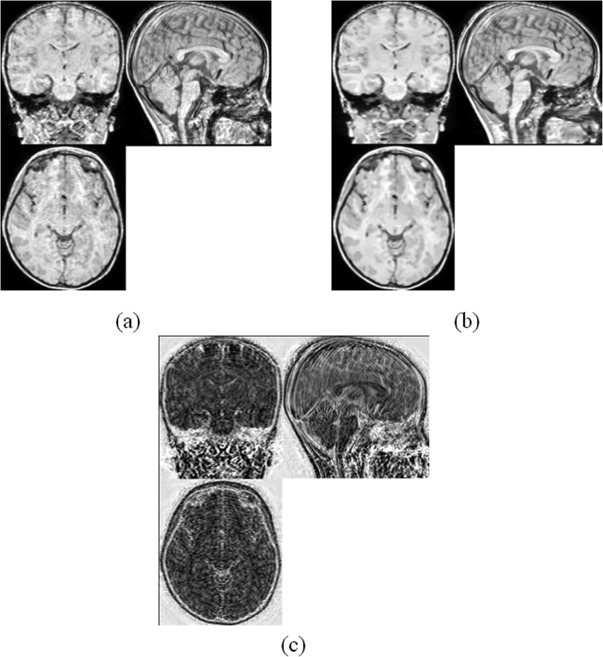
The MRI image applied with NLM filter. (a) Original MRI image. (b) MRI image after NLM filtering. (c) The error image.
N4ITK bias field correction
Bias field is a low frequency intensity nonuniformity present in the image data, which arises from the imperfections of the image acquisition process. Because of the exisitence of bias field, the intensity of the same tissue varies with the location of the tissue within the image [Vovk et al., 2007]. Many image analysis techniques, such as segmentation and registration, are highly sensitive to the spurious varistions of image intensities. Amongst the various bias correction algorithms that have been proposed in the research literature, the nonparametric nonuniform normalization (N3) approach formulated in Sled et al. [1998] has established itself as a standard in the field. It is iterative and seeks the smooth multiplicative field that maximizes the high frequency content of the distribution of tissue intensity. Later, N4ITK [Tustison et al., 2010], as a variant of the N3 algorithm, proposed the substitution of a newly developed fast and robust B‐spline approximation routine and a modified hierarchical optimization scheme for improved bias field correction over the original N3 algorithm. N4ITK has been imbedded into 3D Slicer, which is used for bias field correction in this study. With bias field correction, the inhomogeniety of intensity can be reduced, which would improve the performance of registration and segmentation.
Non‐local mean filtering
MR images are contaminated by random noise which limits the accuracy of any quantitative measurements from the data. Non‐local mean (NLM) filter [Manjón et al., 2008] is a recently developed and widely used denoising algorithm. Unlike other local smoothing filters, NLM filter averages all observed pixels to recover a single pixel. The weight of each pixel depends on the distance between its intensity gray level vector and that of the target pixel. In MR images, the image intensity in the presence of noise is shown to be governed by a Rician distribution [Gudbjartsson and Patz, 1995]. To estimate the noise level of MR images, the noise measurement method in Rajan et al. [2010] is used. Then NLM filter is applied with the estimated noise level. The basic priciple of NLM is illustrated as follows. Given a noisy image I, the estimated denoised image O is calculated as a weighted average of all the pixels in the image:
where Ni denotes a square neighborhood of fixed size and centered at a pixel i, Z(i) is the normalizing constant, and h acts as the degree of filtering. NLM averages similar image pixels according to their intensity distance. It uses more robust regional information rather than pixel‐wise information to compute the similarity between pixels. The ability of NLM reduing random noise in MR images has been well demonstrated in many literatures [Buades et al., 2005; Manjón et al., 2008]. In our case, we find that NLM filter not only can reduce the noise level but also can help reduce the motion artifacts. The motion artifacts always exist in a local region and follow a stripe‐like pattern. The dissimilarity between the background and the stripe artifacts reduces the contribution of motion artifacts in calculating the filtered background intensity. We demonstrate the performance of NLM filter with one example, as shown in Figure 1. It can be seen obviously that the noise removed includes both random noise and artifacts in a stripe pattern.
Enhance tissue contrast
The low tissue contrast in child brain MR images can influence the performance of subsequent image registration, as it brings some difficulties in finding correspondences between images with the unclear boundaries between structures. The relative lower tissue contrast in child brain MR images compared with adult brain MR images is mainly due to the incomplete myelination and larger noise during image acquisition. To increase the tissue contrast, it is proposed in this study to match the histogram of a child brain MR image with that of a standard adult brain atlas. We use Colin27 atlas, an average atlas of 27 T1 MRI scans of the same individual, as the target brain scan. Colin27 provides a lot of anatomical details, thus it is helpful to use its histogram as the target histogram. It is clearly seen in Figure 2 that the tissue contrast of a child MR image can be greatly enhanced by matching its histogram towards the histogram of an adult MR image. With this improvement, the boundaries between some major tissues, such as white matter (WM), gray matter (GM), and cerebrospinal fluid (CSF), can be much more clear, helping increase the accuracy of ensuing image registration for atlas construction.
Figure 2.
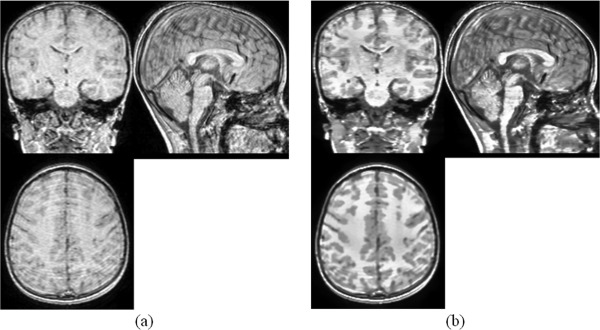
(a) The original MRI scan; (b) MRI scan after contrast enhancement.
Atlas Construction
To generate an atlas from a population, groupwise registration is used to bring the group of images into the common space and the group mean image is calculated to serve as the atlas image. We use the symmetric image normalization (SyN) algorithm in ANTS software (http://www.picsl.upenn.edu/ANTS/) to implement groupwise registration because it is one of nonlinear registration methods with top performance [Klein et al., 2009]. It realizes a symmetric registration method within the space of diffeomorphic maps and provides the Euler‐Lagrange equations necessary for optimization. It defines a variational energy that explicitly divides the image registration diffeomorphisms into two halves such that the moving image and the reference image contribute equally to the path and deformation is divided between them. SyN guarantees subpixel accurate, invertible transformations in the discrete domain by directly including invertibility constraints in the optimization. We use cross‐correlation (CC) that estimates the local image average and variance as our intensity similarity metric. In our experiments, CC can give the best performance compared with other similarity metrics, such as mean square difference and mutual information.
Intensity‐based registration can have good performance in aligning the subcortical structures, but it sometimes has poor performance in matching cortical folding patterns of the human cerebral cortex due to the difficulty to distinguish neighboring folds with similar geometric characteristics and find the cortical folds correspondences across subjects. To handle this problem, we employ a registration method combining both intensity and cortical folds matching.
BrainVISA (http://brainvisa.info/) can help extract the sulci automatically for each brain. BrainVISA is a popular software platform of brain morphology analysis, and has been widely used [Clouchoux et al., 2010; Gimenez et al., 2006; Juch et al., 2005; Sun et al., 2007]. We use the morphologist 2012 [Perrot et al., 2011] toolbox in BrainVISA to recognize sulci. The toolbox uses a coherent Bayesian framework to automatically identify approximately 60 sulcal labels per hemisphere based on a probabilistic atlas (a mixture of spam models: Statistical Probabilistic Anatomy Map) estimating simultaneously normalization parameters. These sulcal labels are used as landmarks in registration, so that we can match different sulci in different brains. The preprocessing steps in the above section also help to improve the performance of recognizing and locating the sulci. It is shown in Figure 3a that without preprocessing, some regions of the brain surface tends to be smooth, where sulci cannot be detected in these regions. With improved image quality, the brain surface becomes sharper, thus more sulci can be recognized correctly as shown in Figure 3b.
Figure 3.
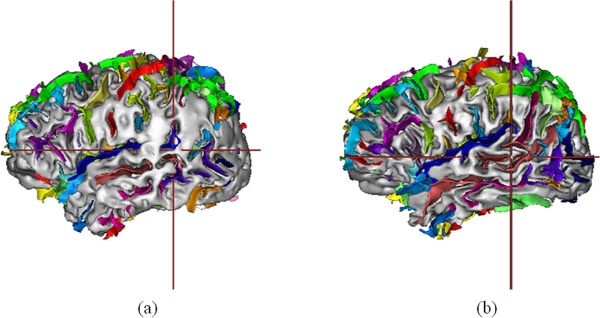
Sulci recognition results using brainVISA. (a) Sulci recognition applied on original MRI data. (b) Sulci recognition applied on preprocessed MRI data. [Color figure can be viewed in the online issue, which is available at http://wileyonlinelibrary.com.]
Landmarks are incorporated into SyN by adding an additional term to the optimization criterion, as described in Yushkevich et al. [2009]. SyN optimizes the prior (landmark) correspondence term simultaneously with the appearance term, leading to a different solution than an unguided normalization, in particular in the vicinity of the landmarks. We equally weight the contribution between intensity metric and landmark metric. The optimization will be performed over three levels of resolution, with a maximum of 50 iterations at the first two coarse levels and 10 iterations at the full resolution level. A Gaussian regularizar with a sigma of 3 that operates only on the deformation field is applied. The optimization will stop when either the energy cannot be smoothly minimized or the maximum number of iterations is reached. In each round of groupwise registration, the group of images are registered towards the tentative group mean image. After each round of groupwise registration, the atlas is computed based on Euclidean mean of the group of aligned images, and served as the reference image for the next round of groupwise registration. The whole process will terminate until convergence (i.e., the change of group mean image is small enough), and the final group mean image will serve as the representative atlas of the population.
RESULTS AND DISCUSSIONS
Atlas Construction
Our atlas construction method was applied on the MRI scans of the 53 children to produce a representative atlas. First of all, one arbitrary chosen image served as the target image and all other images were affinely registered to the target image. A tentative group mean image was produced and served as intermediate atlas image. Then nonrigid intensity and sulci landmark combined groupwise registration was performed to bring the population of images into the common space. In our experiments, three rounds of groupwise registration were sufficient to reach convergence. With the population of images progressively approached the center, the intermediate atlas image was updated, and its anatomical details grew clearer and clearer, as shown in Figure 4. To observe the progression of the population of images, the standard deviation maps of the population in the end of each round of groupwise registration are also shown in Figure 5, where we can clearly see that the voxel‐wise intensity variability is gradually reduced with successive iterations.
Figure 4.
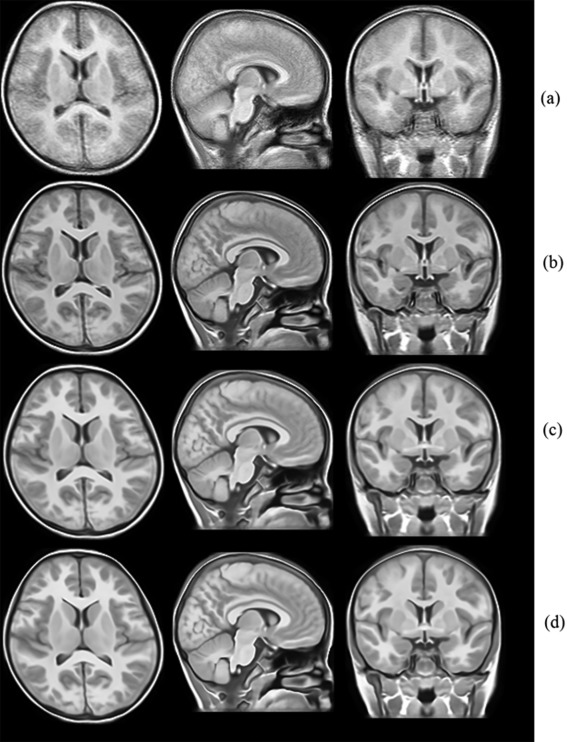
The atlas constructed in each round of registration. (a) Atlas constructed after affine registration. (b)–(d) Atlases constructed after each round of nonrigid registration.
Figure 5.
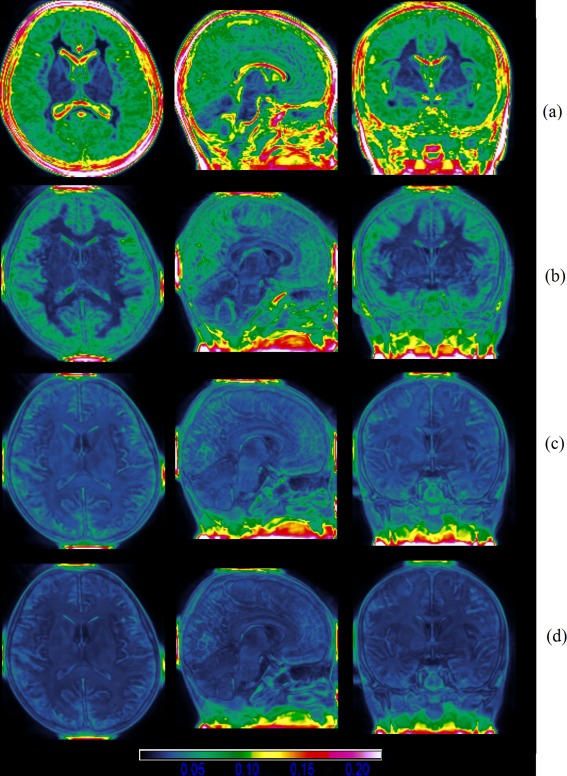
The intensity standard deviation after each round of registration. From (a) to (d), the intensity standard deviation is gradually reduced, indicated by the color of the map. Warm color indicates large deviation, and cold color indicates small deviation. [Color figure can be viewed in the online issue, which is available at http://wileyonlinelibrary.com.]
To obtain the tissue segmentation labels for the atlas image, FAST (FMRIB's Automated Segmentation Tool) was used [Zhang et al., 2001], as it does not need any a prior information for segmentation. It can automatically segment WM, GM, and CSF using a hidden Markov random field model and associated Expectation‐Maximization algorithm. The resulting tissue maps of the atlas together with the intensity slice of the final atlas are shown in Figure 6.
Figure 6.

The final constructed atlas and its tissue maps. From left to right are the atlas intensity image, WM tissue map, GM tissue map, and CSF tissue map.
Atlas Comparison
We designed the method to construct the Chinese pediatric atlas, which can better represent the shape and size of the Chinese pediatric population. To show the benefit of creating such an atlas, we compare our atlas with other standard atlases, that is, the Chinese adult brain atlas, the ICBM 152 atlas, and the UNC pediatric atlas. The first two standard atlases are publicly available on http://www.loni.ucla.edu/Atlases/, the UNC pediatric atlas is available on http://www.nitrc.org/projects/unc_brain_atlas/.
Chinese adult brain atlas, which is an average brain template composed of high quality brain MRI data from 56 Chinese young subjects (24.46 ± 1.81 years). The T1 weighted MR images were acquired on a 3.0 T GE SIGNA scanner. The imaging parameters are: 1.40 mm axial slices, TR/TE = 6.68/2.88 ms, flip angle = 25°, FOV = 240 × 240 mm2, matrix size = 512 × 512 × 248, voxel size = 0.47 × 0.47 × 0.70 mm3. All Chinese brains were spatially normalized using linear and nonlinear transformation via the “AIR Make Atlas” pipeline workflow within the LONI pipeline environment;
ICBM 2009c nonlinear asymmetric atlas. The MRI data from 152 young normal adults (18.5–43.5 years) were acquired on a Philips 1.5 T scanner. The imaging parameters are: 140 slices, TR/TE = 18/10 ms, flip angle = 30°, FOV = 256 × 204 mm2. The atlas construction procedure involved multiple iterations of a process, where at each iteration, individual native MRIs were non‐linearly fitted to the average template from the previous iteration, beginning with the MNI152 linear template;
The UNC pediatric atlas, created by NeuroImage Research and Analysis Laboratories at UNC‐Chapel Hill, was constructed using 10 4‐year old cases plus mirrored ones. It was created from training images by iterative, joint deformable registration into an unbiased average image. Imaging parameters and detailed information about the training images are not provided on the website.
Chinese pediatric atlas created uisng traditional atlas construction protocol. To further demonstrate the usefulness of the proposed atlas construction procedure (the preprocessing steps and the new registration method), we also create an atlas using traditional atlas construction protocol based on our MRI data. The compared protocol follows the gerneral scheme used in the standard atlas construction (Chinese_56 atlas, ICBM atlas, and UNC pediatric atlas). The images were first linearly aligned to a targe image (with FLIRT registration [Jenkinson, 2001]), the tentative linear atlas was created using intensity average. Then nonlinear registrations (intensity‐based SyN method in ANTS software) were applied to warp the images to the tentative average brain atlas for several rounds and generated the final nonlinear brain atlas.
The original MRI scans of the compared atlases are shown in Figure 7. Furthermore, to compare the size and shape of the Chinese pediatric atlas with other atlases, all the atlases were rigidly aligned in ICBM152 space using a six‐parameter transformation to preserve the original characteristics in size and volume. The global features of the atlases were measured and some differences were found among different atlases, as indicated in Table 1. It is found that Chinese pediatric atlas (mean age of 7 years) is relatively shorter in length than UNC pediatric (mean age of 4 years), and its W/L, H/L, and H/W ratios are closer to 1 than other atlases. Although we use different methods to construct the atlas based on Chinese pediatric population, the measured global features are consistent and the differences mainly lie in the sharpness of the brain structures presented in the atlas images (as seen in Fig. 7d,e).
Figure 7.
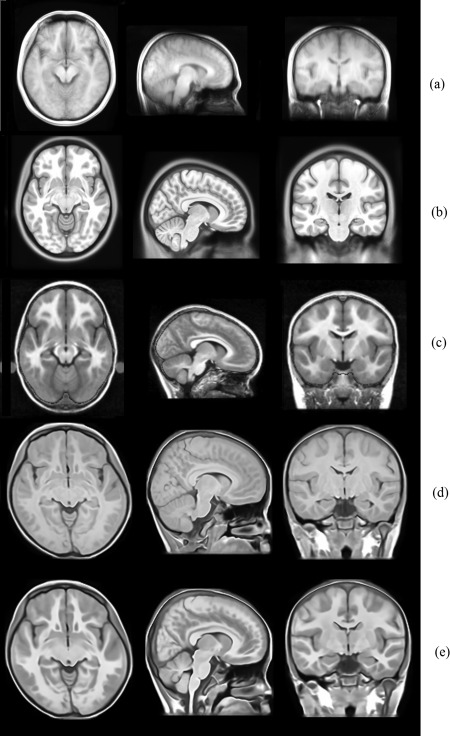
The atlases to be compared with our atlas. (a) The Chinese adult atlas constructed based on 56 Chinese young subjects; (b) ICBM 152 nonlinear asymmetric atlas created based on 152 young subjects; (c) UNC pediatric atlas constructed based on 10 4‐year old subjects. (d) Atlas constructed with traditional protocol based on our Chinese pediatric data. (e) Atlas constructed with proposed protocol based on our Chinese pediatric data.
Table 1.
The comparison of brain size between Chinese pediatric atlas and other standard atlases
| Atlas | Length (mm) | Width (mm) | Height (mm) | W/L | H/L | H/W |
|---|---|---|---|---|---|---|
| Chinese56 | 169 | 144 | 110 | 0.86 | 0.66 | 0.77 |
| ICBM 152 | 177 | 136 | 124 | 0.77 | 0.70 | 0.91 |
| UNC Pediatric | 151 | 115 | 93 | 0.76 | 0.62 | 0.81 |
| Chinese Pediatric atlas(old protocol) | 148 | 133 | 106 | 0.90 | 0.72 | 0.80 |
| Chinese Pediatric atlas (proposed protocol) | 148 | 133 | 106 | 0.90 | 0.72 | 0.80 |
Tissue segmentation by atlas‐based segmentation algorithm
With the constructed atlas and its tissue maps, we can segment the population of pediatric images using registration‐based segmentation method. Registration was performed between each atlas intensity image and the 53 pediatric brain MR scans. The SyN method in ANTS software was used for image registration, with CC served as similarity metric. Three level multi‐resolution registration was performed, with a maximum of 100 iterations at the first two coarse levels and 20 iterations at the full resolution level. A Gaussian regularizar with a sigma of 3 operates only on the deformation field. The resulting deformation fields were applied on the tissue maps of the atlas, forming the tissue maps for each pediatric subject. These atlas‐based segmentation results are compared with the automatic segmentation results obtained using FAST. Quantative comparison is conducted based on Dice volume overlap [Dice, 1945] of WM, GM, and CSF, shown in Table 2. The Student's t‐test was performed on the Dice comparison, and statistically significant difference was found between our atlas and other atlases (P < 0.001). It can be seen that using our atlas much higher segmentation accuracy can be obtained than using other atlases.
Table 2.
Segmentation results comparison
| Atlas | WM | GM | CSF |
|---|---|---|---|
| Chinese56 | 0.712 ± 0.015 | 0.665 ± 0.020 | 0.546 ± 0.070 |
| ICBM 152 | 0.779 ± 0.016 | 0.746 ± 0.027 | 0.587 ± 0.055 |
| UNC Pediatric | 0.806 ± 0.023 | 0.738 ± 0.023 | 0.608 ± 0.033 |
| Chinese Pediatric atlas (old protocol) | 0.545 ± 0.036 | 0.541 ± 0.038 | 0.288 ± 0.038 |
| Chinese Pediatric atlas (proposed protocol) | 0.819 ± 0.017 | 0.783 ± 0.023 | 0.656 ± 0.052 |
The dice volume overlap (mean ± standard deviation) of WM, GM, and CSF using different atlases.
Registration with new pediatric brains
To show the effect of atlas choice in registeration, we conducted image registration experiments using the five atlases. We chose 15 new and distinct Chinese pediatric brains (10 males and 5 females aged 11.68 ± 0.14 years), the imaging parameters can refer to Subjects and Image Requisition section. We registered each of the five atlas images to these brains using SyN method in ANTS. The registration parameters are consistent among different atlases: similarity metric is CC, iteration number is 100 × 100 × 20, Gaussian sigma is 3. One example of registration result is shown in Figure 8. It can be visually inspected that using our constructed atlas to register a Chinese pediatric brain can yield more accurate results. With other atlases, more artifacts exist in the registered image. To quantatively demonstrate the benefit of using our atlas, the mean magnitude of deformation field and mean magnitude of log Jacobian of the deformation field were compared in Table 3. It is shown that the magnitudes of deformation and log Jacobian are significant smaller (P < 0.001) using our atlas (both using old protocol and our new protocol) than using other atlases. It indicates that our atlas requires less deformation to register the Chinese pediatric brains and can better represent the shape and size of the Chinese pediatric population.
Figure 8.
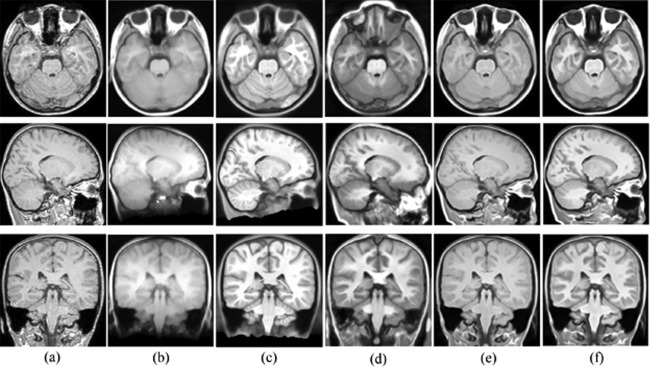
Registration example with different atlases. Panel (a) is the target image to be registered. (b) Registration result with Chinese_56 atlas; (c) registration result with ICBM 152 atlas; (d) registration result with UNC pediatric atlas; (e) registration result with our atlas using old protocol; (f) registration result with our atlas using proposed new method.
Table 3.
The comparison of mean magnitudes of deformation field and log Jacobian map in registering Chinese pediatric data using different atlases
| Atlas | Magnitude of deformation (mean ± standard deviation) | P‐value | Magnitude of log Jacobian (mean ± standard deviation) | P‐value |
|---|---|---|---|---|
| Chinese56 | 24.08 ± 2.86 | 3.67E‐18 | 0.37 ± 0.04 | 1.08E‐06 |
| ICBM 152 | 21.59 ± 2.49 | 1.76E‐17 | 0.46 ± 0.06 | 6.50E‐11 |
| UNC Pediatric | 9.77 ± 2.38 | 2.78E‐05 | 0.49 ± 0.07 | 1.59E‐10 |
| Chinese Pediatric atlas (old protocol) | 5.67 ± 2.02 | 0.897 | 0.27 ± 0.04 | 0.174 |
| Chinese Pediatric atlas (proposed protocol) | 5.57 ± 2.10 | 0.25 ± 0.04 |
Student's t‐test has been conducted to measure the statisitical difference between each compared atlas and our new atlas, with P‐values reported.
CONCLUSIONS
In this article, we have presented a method for generating a representative atlas for Chinese pediatric population. Facing the challenge of handling low quality of MRI pediatric brain images, we designed several special preprocessing techniques to improve the image quality and proposed to use an intensity and sulci landmark combined groupwise registration method. It is demonstrated that the resulting atlas maintains high anatomical details and shows better performance in atlas‐based segmentation compared with other standard atlases. And our newly designed procedure for pediatric atlas construction shows better performance in atlas construction, which results a much sharper atlas and shows higher segmentation accuracy. It is further validated with registration examples that our atlas can better represent the Chinese pediatric population, which validates the necessity of creating such atlas for the specific population. In the future work, the created Chinese pediatric atlas will help us perform more pediatric study, such as study of the development of brains of children, the comparison between healthy children and children with autism or other neurological diseases.
This article was published online on 17 January 2014. An error was subsequently identified. This notice is included in the online and print versions to indicate that both have been corrected 20 March 2014.
REFERENCES
- Bai J, Abdul‐Rahman MF, Rifkin‐Graboi A, Chong YS, Kwek K, Saw SM, Godfrey KM, Gluckman PD, Fortier MV, Meaney MJ, Qiu A (2012): Population differences in brain morphology and microstructure among Chinese. PLoS ONE 7:Special section:e47816. [DOI] [PMC free article] [PubMed] [Google Scholar]
- Balci SK, Golland P, Shenton M, Wells WM (2007): Free‐form B‐spline deformation model for groupwise registration. Med Image Comput Comput Assist Interv 10:23–30. [Google Scholar]
- Bhatia KK, Aljabar P, Boardman JP, Srinivasan L, Murgasova M, Counsell SJ, Rutherford MA, Hajnal J, Edwards AD, Rueckert D (2007): Groupwise combined segmentation and registration for atlas construction. Med Image Comput Comput Assist Interv 10:532–540. [DOI] [PubMed] [Google Scholar]
- Buades A, Coll B, Morel JM (2005): A non‐local algorithm for image denoising. Comput Vis Pattern Recogn 2:60–65. [Google Scholar]
- Clouchoux C, Riviere D, Mangin JF, Operto G, Regis J, Coulon O (2010): Model‐driven parameterization of the cortical surface for localization and inter‐subject matching. Neuroimage 50:552–566. [DOI] [PubMed] [Google Scholar]
- Collins DL, Neelin P, Peters TM, Evans AC (1994): Automatic 3‐D intersubject registration of MR volumetric data in standardized Talairach space. J Comput Assist Tomogr 18:192–205. [PubMed] [Google Scholar]
- Dice L (1945): Measures of the amount of ecologic association between species. Ecology 26:297–302. [Google Scholar]
- Fletcher PT, Venkatasubramanian S, Joshi S (2009): The geometric median on Riemannian manifolds with application to robust atlas estimation. Neuroimage 45:S143–152. [DOI] [PMC free article] [PubMed] [Google Scholar]
- Fonov V, Evans AC, Botteron K, Almli CR, McKinstry RC, Collins DL (2011): Unbiased average age‐appropriate atlases for pediatric studies. Neuroimage 54:313–327. [DOI] [PMC free article] [PubMed] [Google Scholar]
- Gerber S, Tasdizen T, Thomas Fletcher P, Joshi S, Whitaker R (2010): Alzheimers disease neuroimaging initiative (ADNI). Manifold modeling for brain population analysis. Med Image Anal 14:643–653. [DOI] [PMC free article] [PubMed] [Google Scholar]
- Giedd JN, Rumsey JM, Castellanos FX, Rajapakse JC, Kaysen D, Catherine Vaituzis A, Vauss YC, Hamburger SD, Rapoport JL (1996): A quantitative MRI study of the corpus callosum in children and adolescents. Dev Brain Res 91:274–280. [DOI] [PubMed] [Google Scholar]
- Giedd JN, Blumenthal J, Jeffries NO, Castellanos FX, Liu H, Zijdenbos A, Paus T, Evans AC, Rapoport JL (1999): Brain development during childhood and adolescence: A longitudinal MRI study. Nat Neurosci 2:861–863. [DOI] [PubMed] [Google Scholar]
- Gimenez M, Junque C, Vendrell P, Narberhaus A, Bargallo N, Botet F, Mercader JM (2006): Abnormal orbitofrontal development due to prematurity. Neurology 67:1818–1822. [DOI] [PubMed] [Google Scholar]
- Gogtay N, Giedd J, Rapoport JL (2002): Brain development in healthy, hyperactive, and psychotic children. Arch Neurol 59:1244–1248. [DOI] [PubMed] [Google Scholar]
- Gudbjartsson H, Patz S (1995): The rician distribution of noisy MRI data. Magn Reson Med 34:910–914. [DOI] [PMC free article] [PubMed] [Google Scholar]
- Holmes CJ, Hoge R, Collins L, Woods R, Toga AW, Evans AC (1998): Enhancement of MR images using registration for signal averaging. J Comput Assist Tomogr 22:324–333. [DOI] [PubMed] [Google Scholar]
- Jia H, Wu G, Wang Q, Shen D (2010): Absorb: Atlas building by selforganized registration and bundling. NeuroImage 51:1057–1070. [DOI] [PMC free article] [PubMed] [Google Scholar]
- Joshi S, Davis B, Jomier M, Gerig G (2004): Unbiased diffeomorphic atlas construction for computational anatomy. Neuroimage 23(Suppl 1):S151–160. [DOI] [PubMed] [Google Scholar]
- Juch H, Zimine I, Seghier ML, Lazeyras F, Fasel JH (2005): Anatomical variability of the lateral frontal lobe surface: Implication for intersubject variability in language neuroimaging. Neuroimage 24:504–514. [DOI] [PubMed] [Google Scholar]
- Klein A, Andersson J, Ardekani BA, Ashburner J, Avants B, Chiang MC, Christensen GE, Collins DL, Gee J, Hellier P, Song JH, Jenkinson M, Lepage C, Rueckert D, Thompson P, Vercauteren T, Woods RP, Mann JJ, Parsey RV. (2009): Evaluation of 14 nonlinear deformation algorithms applied to human brain MRI registration. Neuroimage 46:786–802. [DOI] [PMC free article] [PubMed] [Google Scholar]
- Learned‐Miller E. (2006): Data driven image models through continuous joint alignment. IEEE Trans Pattern Anal Mach Intell 28:236–250. [DOI] [PubMed] [Google Scholar]
- Lee JS, Lee DS, Kim J, Kim YK, Kang E, Kang H, Kang KW, Lee JM, Kim JJ, Park HJ, et al. (2005): Development of Korean standard brain templates. J Korean Med Sci 20:483–488. [DOI] [PMC free article] [PubMed] [Google Scholar]
- Lenroot RK, Giedd JN (2006): Brain development in children and adolescents: Insights from anatomical magnetic resonance imaging. Neurosci Biobehav Rev 30:718–729. [DOI] [PubMed] [Google Scholar]
- Manjón JV, Carbonell‐Caballero J, Lull JJ, García‐Martí G, Martí‐Bonmatí L, Robles M (2008): MRI denoising using non‐local means. Med Image Anal 12:514–523. [DOI] [PubMed] [Google Scholar]
- Mazziotta JC, Toga AW, Evans AC, Fox P, Lancaster J (1995): A probabilistic atlas of the human brain: Theory and rationale for its development. NeuroImage 2:89–101. [DOI] [PubMed] [Google Scholar]
- Nitsche MAN, Hoffmann KT, Hengst S, Liebetanz D, Paulus W, Meyer BU (2004): MRI study of human brain exposed to weak direct current stimulation of the frontal cortex. Clin Neurophysiol 115:2419–2423. [DOI] [PubMed] [Google Scholar]
- Perrot M, Rivière D, Mangin JF (2011): Cortical sulci recognition and spatial normalization. Med Image Anal 15:529–550. [DOI] [PubMed] [Google Scholar]
- Rajan J, Poot D, Juntu J, Sijbers J (2010): Noise measurement from magnitude MRI using local estimates of variance and skewness. Phys Med Biol 55:N441–N449. [DOI] [PubMed] [Google Scholar]
- Shi F, Yap PT, Wu GR, Jia HJ, Gilmore JH, Lin WL, Shen DG (2011): Infant brain atlases from neonates to 1‐ and 2‐year‐olds. PLoS One 6:e18746. [DOI] [PMC free article] [PubMed] [Google Scholar]
- Sled JG, Zijdenbos AP, Evans AC (1998): A nonparametric method for automatic correction of intensity nonuniformity in MRI data. IEEE Trans Med Imag 17:87–97. [DOI] [PubMed] [Google Scholar]
- Sun ZY, Riviere D, Poupon F, Regis J, Mangin JF (2007): Automatic inference of sulcus patterns using 3D moment invariants 10:515–522. [DOI] [PubMed] [Google Scholar]
- Talairach J, Tournoux P (1988): Co‐planar Steorotaxic Atlas of the Human Brain: Three Dimensional Proportional System—An Approach to Cerebral Imaging. New York: Thieme Medical Publishers. [Google Scholar]
- Tang YC, Hojatkashani C, Dinov ID, Sun B, Fan L, Lin X, Qi H, Hua X, Liu S, Toga AW (2010): The construction of a Chinese MRI brain atlas: A morphometric comparison study between Chinese and Caucasian cohorts. Neuroimage 51:33–41. [DOI] [PMC free article] [PubMed] [Google Scholar]
- Toga A, Thompson P, Narr K, Sowell E (2003): Databasing the Brain: From Data to Knowledge. New York: Wiley. [Google Scholar]
- Tustison NJ, Avants BB, Cook PA, Zheng YJ, Egan A, Yushkevich PA, Gee JC (2010): N4ITK: Improved N3 bias correction. IEEE Trans Med Imaging 29:1310–1320. [DOI] [PMC free article] [PubMed] [Google Scholar]
- Vovk U, Pernus F, Likar B (2007): A review of methods for correction of intensity inhomogeneity in MRI. IEEE Trans Med Imaging 26:405–421. [DOI] [PubMed] [Google Scholar]
- Wang Q, Wu GR, Yap PT, Shen DG (2010): Attribute vector guided groupwise registration. Neuroimage 50:1485–1496. [DOI] [PMC free article] [PubMed] [Google Scholar]
- Wang X, Chen N, Zuo ZT, Xue R, Jing L, Yan Z, Shen DG, Li KC (2013): Probabilistic MRI brain anatomical atlases based on 1,000 Chinese subjects. PLoS One 8:e50939. [DOI] [PMC free article] [PubMed] [Google Scholar]
- Wilke M, Schmithorst VJ, Holland SK (2003): Normative pediatric brain data for spatial normalization and segmentation differs from standard adult data. Magn Reson Med 50:749–757. [DOI] [PubMed] [Google Scholar]
- Wu G, Jia H, Wang Q, Shen D (2011): Sharpmean: Groupwise registration guided by sharp mean image and tree‐based registration. Neuroimage 56:1968–1981. [DOI] [PMC free article] [PubMed] [Google Scholar]
- Yushkevich PA, Avants BB, Pluta J, Das S, Minkoff D, Mechanic‐Hamilton D, Glynn S, Pickup S, Liu W, Gee JC, et al. (2009): A high‐resolution computational atlas of the human hippocampus from postmortem magnetic resonance imaging at 9.4 T. Neuroimage 44:385–398. [DOI] [PMC free article] [PubMed] [Google Scholar]
- Zhang Y, Brady M, Smith S (2001): Segmentation of brain MR images through a hidden Markov random field model and the expectation‐maximization algorithm. IEEE Trans Med Imaging 20:45–57. [DOI] [PubMed] [Google Scholar]
- Zöllei L, Learned‐Miller E, Grimson E, Wells WM (2005): Efficient population registration of 3D data. ICCV 3765:291–301. [Google Scholar]


