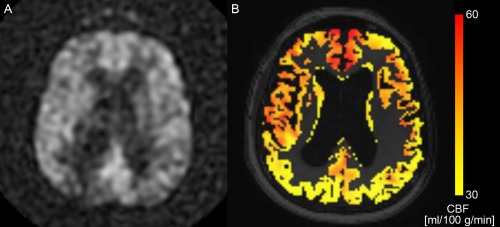
Figure 1.

(A) ASL difference scan (ΔA) of a dementia patient (SNR = 24.4), and (B) the corresponding CBF map in the GM after partial volume correction in color overlay. The background image in (B) is the T1w image. [Color figure can be viewed in the online issue, which is available at http://wileyonlinelibrary.com.]
