
Figure 6.
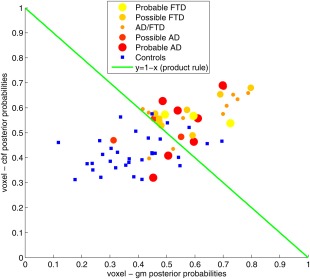
Scatter plot of the posterior probabilities for the voxel‐wise classifications based on GM features (x‐axis) and CBF features (y‐axis). Patients are represented by dots colored and sized according to the assigned provisional diagnostic label. Controls are represented by blue squares. The green line (y = 1 − x) shows the decision boundary for the product rule and mean rule combination methods (for a threshold of 0.5 on the combined posterior probability). [Color figure can be viewed in the online issue, which is available at http://wileyonlinelibrary.com.]