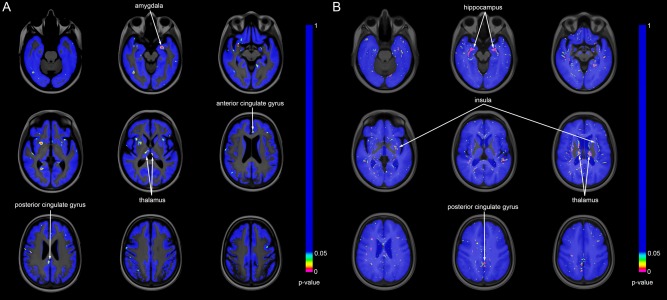
Figure 7.

Statistical significance maps (P‐maps) for the voxel‐wise classifications: (A) CBF, (B) GM. Nonblue voxels are significantly different (P < 0.05) between patient and control groups based on SVM classification. [Color figure can be viewed in the online issue, which is available at http://wileyonlinelibrary.com.]
