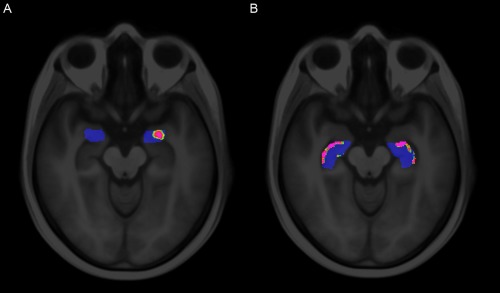
Figure 8.

Voxel‐wise P‐maps (A) within the amygdala for CBF and (B) within the hippocampus for GM. These two regions showed the highest percentage of significant voxels. The regions were based on the region labeling in template space. Nonblue voxels are significantly different (P < 0.05). [Color figure can be viewed in the online issue, which is available at http://wileyonlinelibrary.com.]
