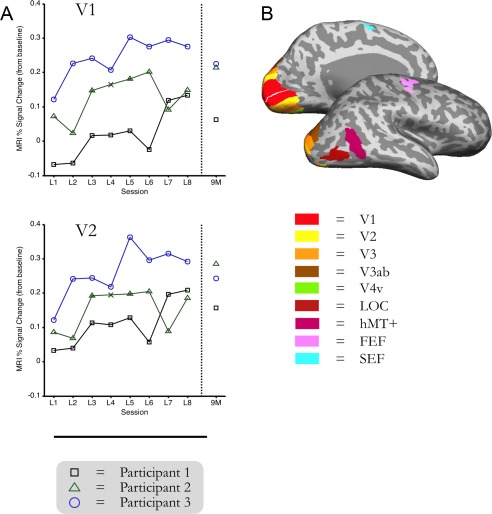
Figure 2.

Functional ROIs and fMRI data over time. Inflated brains depict individually mapped ROIs (V1–V4v), LOC, hMT+, FEF, and SEF in an example participant. Plots show percent‐signal change values (RT‐model) from learning Day 1 to learning Day 8 and from the follow‐up scan after 9 months, relative to fixation‐baseline for V1 and V2 in all participants (each line represents one participant). For illustrative purposes, missing data from Participant 2 on day 4 (due to a scanner problem) is interpolated, and demarcated with an “x.”
