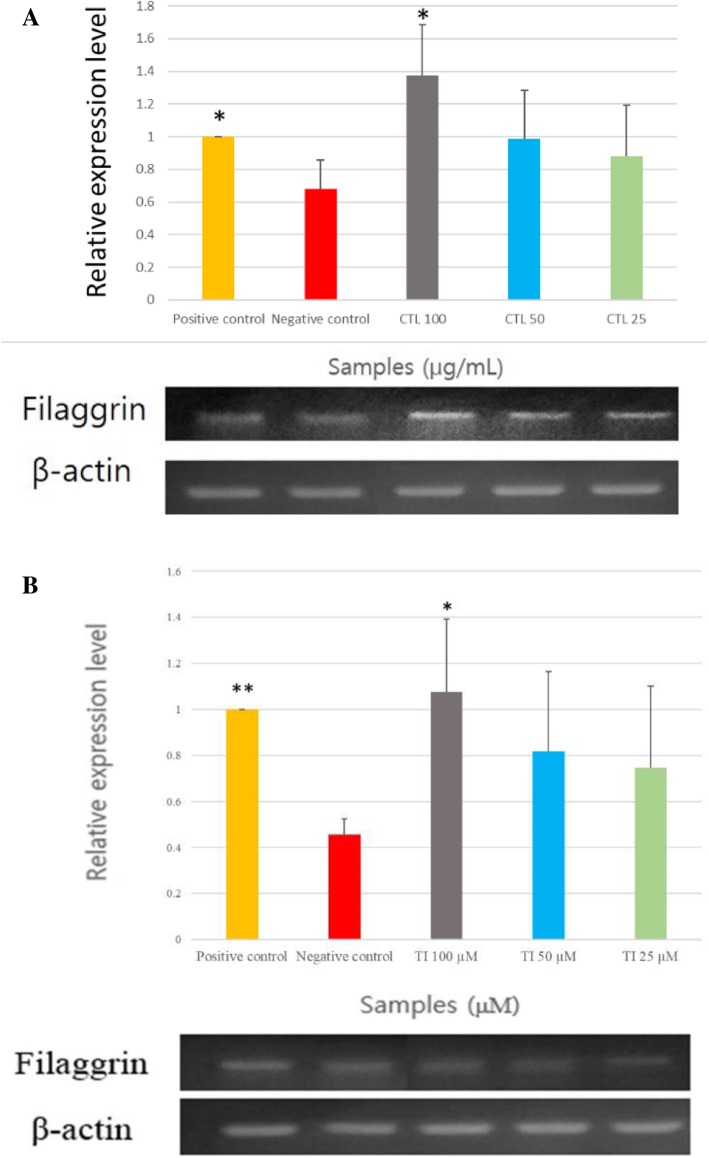
Fig. 1.
Relative filaggrin mRNA expression level upon treatment with (a): Carpinus tschonoskii leaf (CTL) extract and (b): tellimagrandin I (TI) normalized to β-actin. The results are expressed as mean ± standard deviation (SD) of triplicate experiments. (n = 3) **, p < 0.01; *, p < 0.05, comparison with negative control group

