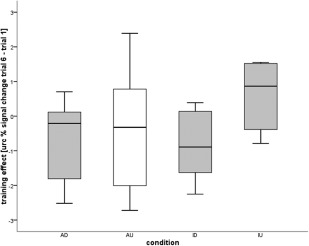
Figure 4.

Magnitude of the regulation effect calculated from the unrelated region corrected BOLD signal change in the rACC upregulation (AU) and downregulation (AD) and pInsL upregulation (IU) and downregulation (ID) condition. The diagram shows the conditions in which control of the activation was achieved (gray) and the AU condition (white) where the group as a whole did not achieve successful regulation. The regulation effect was defined as the difference between regulation of the BOLD effect in the rACC or pInsL in Trial 6 and Trial 1. The absolute magnitude of the learning effect did not significantly differ between the conditions.
