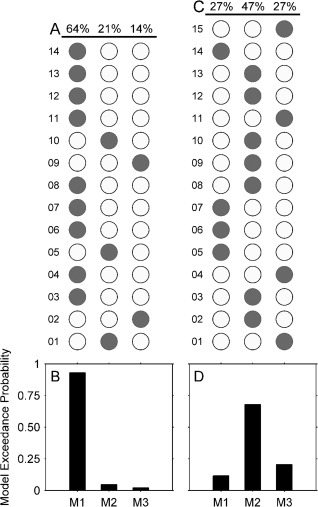
Figure 3.

Bayesian model selection for the three models. (A) Model selection results over all adult participants (N = 14); (B) Model exceedance probability at the adult group level; (C) Model selection results over all child participants (N = 15); (D) Relative exceedance probability at the child group level. Grey dots in A and B indicate the winning models in individual participants.
