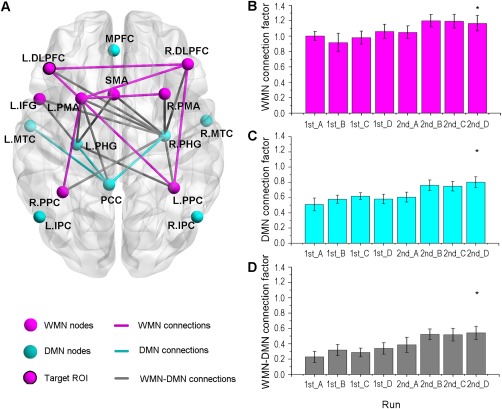
Figure 2.

The change of network connections during the two sessions of rtfMRI training. A. The significantly changed within‐ and between‐network ROI–ROI connections (P < 0.05, FDR corrected, the L. and R. refer to the left and right side, respectively). B. The change of the WMN connection factor across feedback runs. C. The change of the DMN connection factor across feedback runs. D. The change of the WMN–DMN connection factor across feedback runs. The three factors were calculated by factor analysis of the significantly changed within‐ and between‐network ROI–ROI connections in all eight runs, respectively. * refers to significant difference (P < 0.05) in the comparison of run 2nd_D with run 1st_A.
