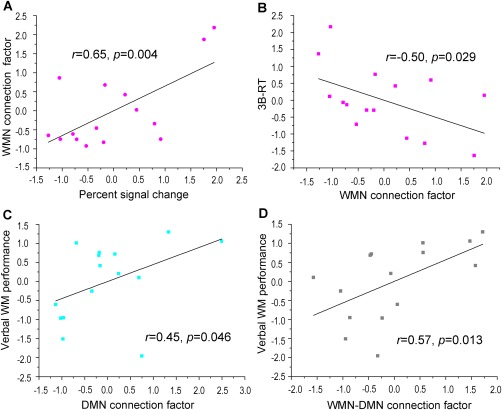
Figure 3.

The correlation of network connection factors with the percent signal change of the target ROI and with the behaviors. A. The positive correlation of percent signal change in the target ROI with the WMN connection factor. B. The negative correlation of the WMN connection factor with the response time of the spatial 3‐back task. C. The positive correlation of the DMN connection factor with verbal WM performance. D. The positive correlation of the WMN–DMN connection factor with verbal WM performance. The data shown in the scatter plot were normalized. [Color figure can be viewed in the online issue, which is available at http://wileyonlinelibrary.com.]
