
Figure 5.
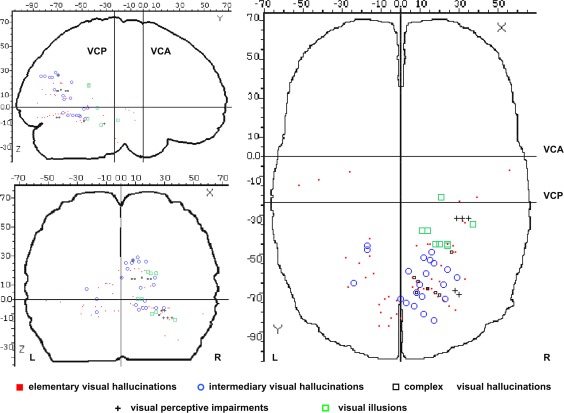
Spatial distribution of types of visual phenomena evoked by stimulation, represented on a schematic brain representation (Talairach and Tournoux coordinates). [Color figure can be viewed in the online issue, which is available at http://wileyonlinelibrary.com.]