
Figure 5.
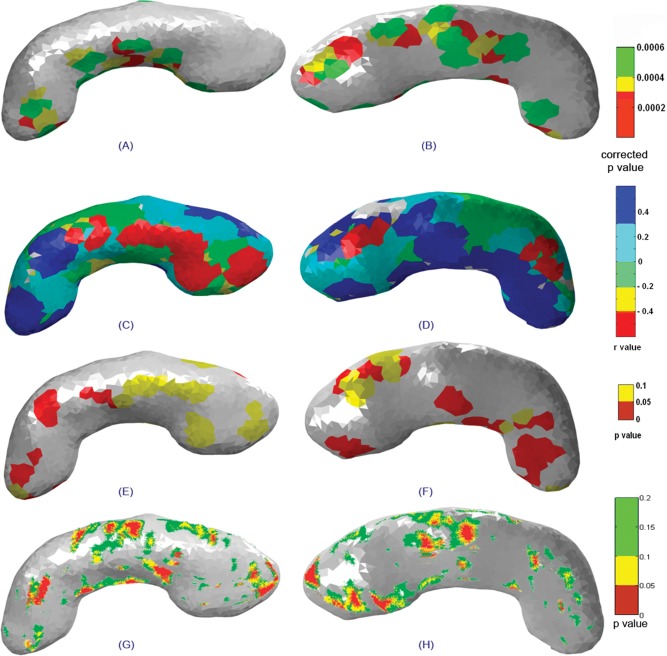
Statistical maps showing superior (left column) and inferior (right column) views of the left hippocampus indicating (A, B) significant deformations between groups, (C, D) correlations between surface deformations and degree of prenatal alcohol exposure, the (E, F) corresponding significance maps, and (G, H) statistical maps of group differences for the left hippocampus obtained using the radial distance method.