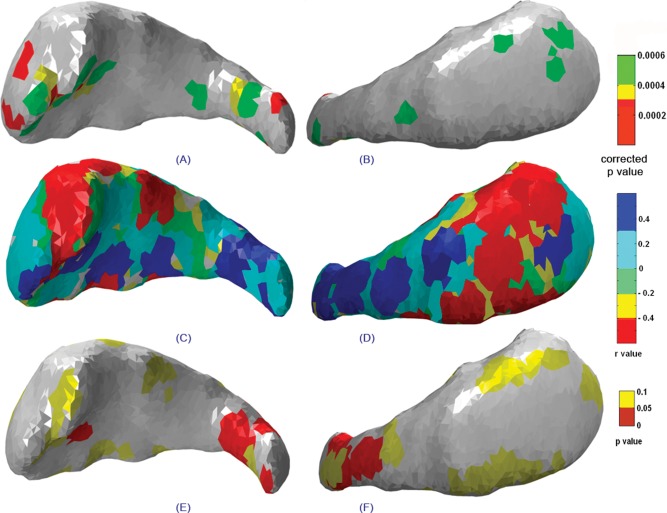
Figure 6.

Statistical maps showing the lateral (left column) and medial (right column) views of the right caudate indicating (A, B) significant group deformations, (C, D) correlations between structure deformation and degree of prenatal alcohol exposure, and (E, F) the significance map corresponding to the correlation map mentioned earlier.
