Figure 5.

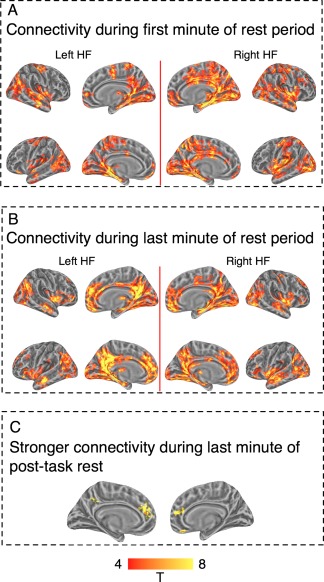
Whole brain connectivity of left hippocampus seed region (left HF) and right hippocampus seed region (right HF) during the first and last 1‐min epochs of a 5‐min rest period. Panel A: connectivity during first minute of rest. Panel B: connectivity during the last minute of rest. In Panels A and B, upper rows mark the right hemisphere cortical surface and lower rows mark the left hemisphere cortical surface. Panel C: direct comparison between connectivity in the first and last minute shows stronger connectivity with PCC and vmPFC during the last minute of rest. The figure shows that connectivity patterns settle into the well‐described hippocampal resting‐state configuration toward the end of the resting‐state epoch, but have a markedly different configuration at its beginning. Thresholded at single voxel alpha level of P < 0.001, familywise corrected for multiple comparisons using cluster‐extent thresholding. [Color figure can be viewed in the online issue, which is available at http://wileyonlinelibrary.com.]
