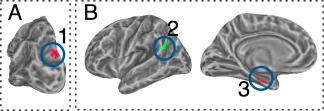
Figure 6.

Impact of current‐rest features and hippocampal laterality. Panel A: stronger connectivity during passive than attentive rest. Panel B: regions showing stronger connectivity with left HF than with right HF. Here and in all subsequent figures colors mark different clusters. Cluster numbers match entries in Table 1. [Color figure can be viewed in the online issue, which is available at http://wileyonlinelibrary.com.]
