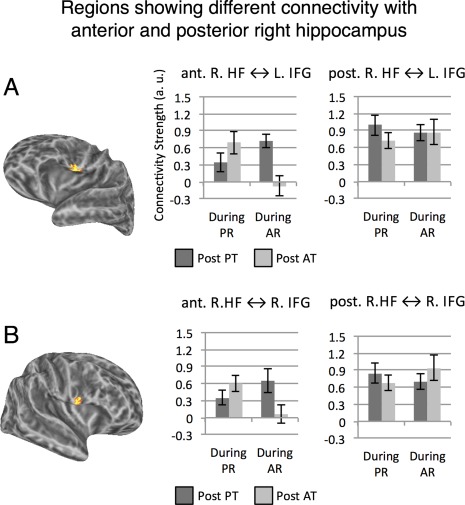
Figure 9.

Regions showing different connectivity with anterior and posterior right HF. Panel A: Left Hemisphere. Panel B: Right Hemisphere. All vertices in warm colors showed a statistically significant three‐way interaction between prior task, current rest and anterior versus posterior HF segment, single‐vertex threshold for interaction tests P < 0.005 corrected for multiple comparisons using cluster extent threshold (FWE P < 0.05). For both left and right IFG, connectivity with posterior right HF was not modulated by the experimental manipulations (i.e., nonsignificant prior task × current rest interactions), but connectivity with anterior right HF was modulated by both factors (Ps < 0.05; see text). [Color figure can be viewed in the online issue, which is available at http://wileyonlinelibrary.com.]
