
Figure 1.
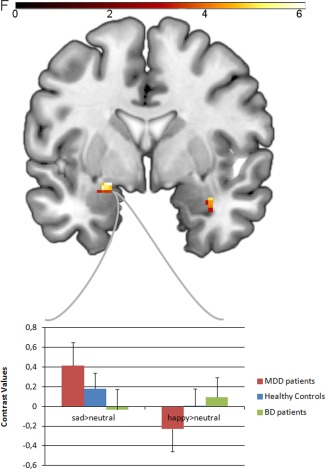
Top: coronal slice (MNI coordinate y = 0) depicting group (3) × emotion (2) interaction in the bilateral amygdala at uncorrected P < 0.05. Color bar, F values. Down: Bar graphs depicting the mean contrast values for sad>neutral faces and happy>neutral faces extracted from significant left amygdala group (3) × emotion (2) cluster (MNI coordinates x = −22, y = −2, z = −16; k = 42 voxels), dependent on emotion and study group. MNI = Montreal neurological Institute. [Color figure can be viewed in the online issue, which is available at http://wileyonlinelibrary.com.]