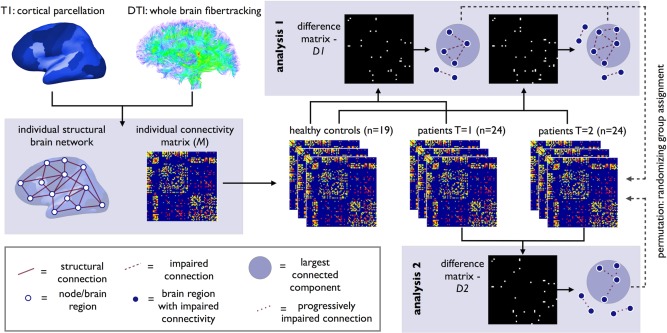
Figure 2.

Overview of longitudinal connectome imaging methods. Cortical and subcortical brain regions were selected by automatic parcellation of the cerebrum. Using the DTI data, white matter tracts of the brain were reconstructed. An individual brain network was defined consisting of nodes (i.e., the parcellated brain regions) and white matter connections between the nodes resulting in a (FA‐weighted) connectivity matrix M. Next, using NBS, the connectivity matrices of ALS patients at T = 1 and T = 2 were compared with healthy controls (Analysis 1). Using t‐statistics each connection was tested resulting in a binary difference matrix (D1); connections with a statistical difference larger than a set threshold of alpha < 0.01 were set to 1, and otherwise to zero. The size of the (largest) connected component in the difference matrix was computed, revealing a subnetwork of affected connectivity in patients. Permutation testing was used to define the p‐value of this component based on the computed null‐distribution of (largest) connected component sizes as can occur under the null‐hypothesis (no difference between patients and controls). An identical analysis was performed comparing brain connectivity at T = 1 and T = 2 in patients (Analysis 2). [Color figure can be viewed in the online issue, which is available at http://wileyonlinelibrary.com.]
