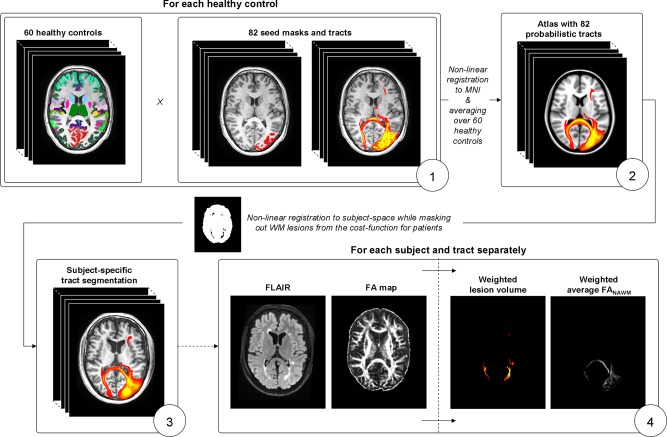
Figure 1.

Construction of the connectivity atlas and quantification of pathology in white matter tracts. (1) For each healthy control, probabilistic tractography is run from 82 gray matter regions to identify the connected tracts; (2) the healthy controls are non‐linearly registered to standard space and averaged to obtain an atlas with 82 probabilistic tracts; (3) the atlas is nonlinearly registered to subject space to obtain an subject‐specific tract segmentation; (4) the average weighted lesion volume and weighted average FANAWM are computed for each subject and tract separately. [Color figure can be viewed in the online issue, which is available at http://wileyonlinelibrary.com.]
