
Figure 4.
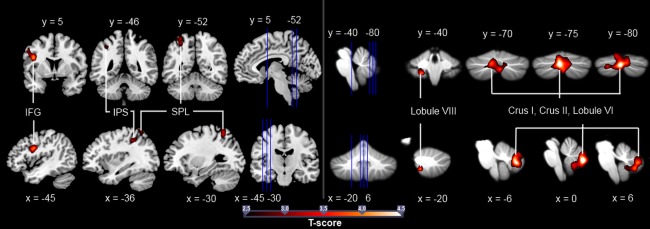
Significantly stronger activation in the tennis experts compared to the novices for the comparison tennis anticipation > observation only. The blue vertical lines indicate the slice positions. T maps were thresholded at t = 2.50 (P < 0.05, FWE‐corrected). Activation is rendered on a high‐resolution T1 template (“colin brain”) as well as on the cerebellar SUIT template [Diedrichsen, 2006].