Abstract
The human orbitofrontal cortex (OFC) is an enigmatic brain region that cannot be parcellated reliably using diffusional and functional magnetic resonance imaging (fMRI) because there is signal dropout that results from an inherent defect in imaging techniques. We hypothesise that the OFC can be reliably parcellated into subregions based on gray matter volume (GMV) covariance patterns that are derived from artefact‐free structural images. A total of 321 healthy young subjects were examined by high‐resolution structural MRI. The OFC was parcellated into subregions‐based GMV covariance patterns; and then sex and laterality differences in GMV covariance pattern of each OFC subregion were compared. The human OFC was parcellated into the anterior (OFCa), medial (OFCm), posterior (OFCp), intermediate (OFCi), and lateral (OFCl) subregions. This parcellation scheme was validated by the same analyses of the left OFC and the bilateral OFCs in male and female subjects. Both visual observation and quantitative comparisons indicated a unique GMV covariance pattern for each OFC subregion. These OFC subregions mainly covaried with the prefrontal and temporal cortices, cingulate cortex and amygdala. In addition, GMV correlations of most OFC subregions were similar across sex and laterality except for significant laterality difference in the OFCl. The right OFCl had stronger GMV correlation with the right inferior frontal cortex. Using high‐resolution structural images, we established a reliable parcellation scheme for the human OFC, which may provide an in vivo guide for subregion‐level studies of this region and improve our understanding of the human OFC at subregional levels. Hum Brain Mapp 36:538–548, 2015. © 2014 Wiley Periodicals, Inc.
Keywords: human brain, orbitofrontal cortex, parcellation, gray matter volume covariance, magnetic resonance imaging
INTRODUCTION
The orbitofrontal cortex (OFC) occupies the ventral surface of the frontal lobe and is one of the least understood regions of the human brain. Brodmann first reported the cytoarchitectural features of the human OFC and subdivided it into areas 10, 11, and 47 [Brodmann, 1909]. However, this nomenclature is not consistent across species [Brodmann and Garey, 2007]. The anatomical connection patterns of the human OFC have been inferred indirectly from studies of non‐human primates. These studies have revealed reciprocal connections between the OFC and the sensory, limbic, and subcortical regions [Barbas, 2007; Cavada et al., 2000; Price, 2007]. The monkey OFC has been divided into “medial” and “orbital” networks [Carmichael and Price, 1996; Ongur and Price, 2000] that are based on intraregional anatomical connections.
Functional magnetic resonance imaging (fMRI) studies have revealed that the human OFC is involved in reward learning, decision making, control of emotion and motivation, cognitive flexibility, and social behavior [Kringelbach, 2005; Kringelbach and Rolls, 2004; Rolls and Grabenhorst, 2008]. Furthermore, several mental disorders are characterized by structural and functional deficits of the OFC [Crespo‐Facorro et al., 2000; Lacerda et al., 2004; van den Heuvel et al., 2009]. These findings highlight the importance of investigation of the human OFC. Although there is considerable evidence for the existence of human OFC subregions [Mackey and Petrides, 2010; Ongur et al., 2003], most fMRI studies report these results using the OFC but not the OFC subregions [Sladky et al., in press]. Multiple brain regions have been parcellated into subregions with characteristic connectivity patterns that are based on anatomical connections identified by diffusion tensor imaging (DTI) or on resting‐state functional connectivity (rsFC) derived from fMRI. The human OFC has been parcellated into six subregions [Kahnt et al., 2012] according to rsFC profiles. The DTI or fMRI parcellation studies are based on the echo planar imaging (EPI) technique. However, using the EPI sequence to image the human OFC is challenging, because this region is adjacent to the air‐filled sinuses. Signal dropout, geometric distortion, and susceptibility artefacts inevitably affect the imaging of the human OFC when the EPI sequence is used [Devlin et al., 2000; Merboldt et al., 2001].
Mechelli et al. have proposed for the first time that the gray matter volume (GMV) of different regions of the human cortex covary across healthy individuals [Mechelli et al., 2005]. Although the exact neural mechanisms underlying GMV covariance are unclear, it has been proposed that GMV covariance may reflect the synchronized maturational changes that are mediated by the development of axonal connections [Mechelli et al., 2005]. This hypothesis is supported by the observed associations of GMV covariance with maturational changes and rsFC [Alexander‐Bloch et al., 2013b]. Thus, GMV covariance may reflect anatomical and functional connectivity among brain regions [Alexander‐Bloch et al., 2013a, Taylor et al., 2012] and could be applied to parcellate complex brain regions. As expected, GMV patterns have been used to successfully parcellate the human insula, patterns which are remarkably consistent with those derived from task‐evoked coactivation and rsFC [Kelly et al., 2012].
Here, the GMV covariance method is particularly suitable for the parcellation of the human OFC because the high‐resolution structural images are free of any imaging artefacts. In this study, we first applied this GMV covariance method to parcellate the human OFC into subregions and investigated GMV covariance pattern of each subregion to determine the connection properties of the subregion. Sex and laterality differences in GMV correlation of each OFC subregion were finally investigated to improve our understanding of this structure at subregional levels.
MATERIALS AND METHODS
Subjects
A total of 323 healthy young subjects (mean age: 22.7 ± 2.5 years; 157 males) participated in this study. Participants were carefully screened to ensure that they had no history of psychiatric or neurological illness, psychiatric treatment, or drug or alcohol abuse, and had no contraindications for MRI examination. All subjects were right handed as determined by the Chinese edition of the Edinburgh Handedness Inventory [Oldfield, 1971]. After a complete description of the study, all subjects provided written informed consent. The protocol was approved by the Ethics Committee of Tianjin Medical University General Hospital.
MRI Data Acquisition
MR images were acquired using a Signa HDx 3.0 Tesla MR scanner (General Electric, Milwaukee, WI). Tight but comfortable foam padding was used to minimise head motion, and earplugs were used to reduce scanner noise. Sagittal 3D T1‐weighted images were acquired by a brain volume sequence (repetition time = 8.1 ms; echo time = 3.1 ms; inversion time = 450 ms; flip angle = 13°; field of view= 256 × 256 mm2; matrix = 256 × 256; slice thickness = 1 mm, no gap; and 176 sagittal slices).
Parcellation of the OFC Based on GMV Covariance
Definition of the seed mask
On the basis of the automated anatomical labeling (AAL) atlas [Tzourio‐Mazoyer et al., 2002], we extracted the OFC seed mask using the following bilateral labels: the superior, middle, inferior, and medial orbital gyrus, and the gyrus rectus. The left and right OFC seed masks were obtained by merging the five AAL regions in each of the corresponding hemispheres.
Data preprocessing
Each slice of every structural image was examined individually. One of the 323 subjects was excluded for bad image quality and another for atrophy of the temporal lobe. A total of 321 subjects were finally included. The structural MR images were segmented into gray matter (GM), white matter, and cerebrospinal fluid using the standard unified segmentation model in the Statistical Parametric Mapping software package (SPM8, http://www.fil.ion.ucl.ac.uk/spm). Following segmentation, a GM population template in Montreal Neurological Institute (MNI) space was generated from the entire image dataset using diffeomorphic anatomical registration through the exponentiated Lie algebra (DARTEL) technique [Ashburner, 2007]. After an initial affine registration of individual GM concentration images to the GM template in MNI space, the coarsely registered GM concentration images were nonlinearly warpped with the population GM template using the DARTEL technique and resampled to a voxel size of 1.5 × 1.5 × 1.5 mm3. The GMV of each voxel was obtained by multiplying the GM concentration map by the nonlinear determinants that had been derived during spatial normalization. Regional GMV in this study, therefore, represents normalized GMV after removing the effect of variance in individual brain sizes. Finally, the GMV images were smoothed with a full width at half maximum kernel of 10 mm. After spatial preprocessing, the normalized, modulated, and smoothed GMV maps were used to estimate GMV covariance.
GMV covariance‐based parcellation
Voxel‐wise GMV covariance quantifies the extent to which GMVs covary between different brain regions across participants [Mechelli et al., 2005]. We calculated the GMV covariance of each voxel of the human OFC seed mask using a previously described method [Kelly et al., 2012; Mechelli et al., 2005; Seeley et al., 2009]. First, we extracted the GMV of each voxel in the whole brain from each participant. Second, we computed Pearson correlation coefficients between the GMV of each seed voxel and all of the non‐OFC voxel in the whole brain across the 321 subjects to construct the correlation matrix (N × M, where N is the voxel number of the OFC mask, and M is the non‐OFC voxel number of the whole brain; Johansen‐Berg et al., 2004). Finally, the cross‐correlation matrix of all voxels in the seed mask was calculated and fed into a spectral clustering algorithm that used edge‐weighted centroidal voronoi tessellations for image segmentation [Wang et al., 2009] for automatic clustering. The procedure was designed to group together voxels of the seed region that share similar covariance profiles with other voxels of the brain. However, the number of component clusters was chosen by the experimenter.
Selection of cluster number
To avoid arbitrary choice of the number of clusters, we used cross‐validation to determine the cluster number that yielded optimal consistency across subjects. This is designated the “optimal cluster number.” Specifically, we used a “leave‐one‐out” method in which each one tenth of subject's data were randomly excluded from the total dataset. For each sub‐dataset, we calculated the overlap ratio between the clustering results from the single sub‐dataset and from the total dataset. The overlap ratio has values in the interval [0, 1], and high values indicate high consistency. The inter‐sub‐dataset overlap was checked for k = 2–25 clusters. We also calculated the coefficient of variation in the overlap ratio for each cluster number across sub‐datasets. Low values indicate high stability of the results.
Calculation of the GMV Covariance Pattern of the OFC Subregions
GMV covariance between each subregion and the whole brain
To reveal the different GMV covariance patterns of the OFC subregions derived from our parcellation, we extracted the mean GMV of each OFC subregion across subjects and then calculated the Pearson correlation coefficients between the GMV of each OFC subregion and those of non‐OFC voxels of the whole brain. A random effect model was applied to identify voxels whose GMVs covaried significantly with those of each OFC subregion. Multiple comparisons were corrected using a family‐wise error (FWE, P < 0.01, two tailed) method.
Target region definition and fingerprint of each OFC subregion
Target regions were defined by the following steps: (1) for each OFC subregion, we generated a binary mask where the GMV of each voxel was significantly positively covaried with the GMV of the subregion; (2) we merged these covariance binary masks into a union mask, where the GMV of each voxel was positively covaried with at least one of these OFC subregions; (3) we identified the intersection voxels between the union mask and each AAL region (a total of 80 regions except for cerebellum and OFC); (4) we calculated the overlapping ratio between the number of the intersection voxels of each ALL region and the total number of voxels of this ALL region; and (5) the 14 AAL regions with the highest overlapping ratio were selected as target regions, which contained relatively more voxels exhibiting GMV covariance with the OFC subregions. These target regions were the bilateral Amygdala (Amyg), anterior cingulate cortex (ACC), mid‐cingulate cortex (MCC), Insula (Ins), inferior frontal gyri (IFG), superior frontal gyri (SFG), and temporal pole (TP). We then calculated the GMV correlation value between each OFC subregion and each of the 14 target regions. We generated fingerprints to demonstrate the covariance patterns of these OFC subregions that were based on the GMV correlation strengths between each OFC subregion and the 14 target regions. We compared differences in GMV correlation between every pair of OFC subregions with each target region using a Williams t‐test [Howell, 2010; Williams, 1959]. Multiple comparisons were corrected using the Bonferroni method (P < 0.05, two tailed).
Laterality Differences in GMV Correlation of the OFC Subregions
The GMV correlation strengths between the 14 target brain regions with each bilateral OFC subregion were calculated. Then, we used a Williams t‐test to test the significance of the laterality effect for each of these 14 GMV correlations. Multiple comparisons were corrected using the Bonferroni method (P < 0.05, two tailed).
Sex Differences in GMV Correlation of the OFC Subregions
We divided subjects into males and females and then generated sex‐specific subgroups to test for a sex effect. The GMV correlation between each OFC subregion and the 14 target regions were calculated based on each subgroup dataset. After the correlation coefficients were converted into z‐values using the Fisher r‐to‐z transformation, a z‐test was used to examine the significance of sex differences for each of these 14 GMV correlations. Multiple comparisons were corrected using the Bonferroni method (P < 0.05, two tailed).
RESULTS
Parcellation of the OFC Based on GMV Covariance
It is important to select an optimal number of clusters when using the spectral clustering method. Although there is no gold standard for selecting the optimal cluster number, we selected a cluster number, that is, based on the consistency of clustering results that are derived from “leave‐one‐out” analyses. We tested 24 clustering schemes with cluster number from 2 to 25. The parcellation results are shown in Figure 1. The overlap ratio and coefficient of variation for each cluster scheme are demonstrated in Figure 2. We found that a cluster number of 5 had the highest mean overlap ratio (0.95) and lowest mean coefficient of variation (4.58; Fig. 2), which was used as the optimal cluster number for parcellation.
Figure 1.
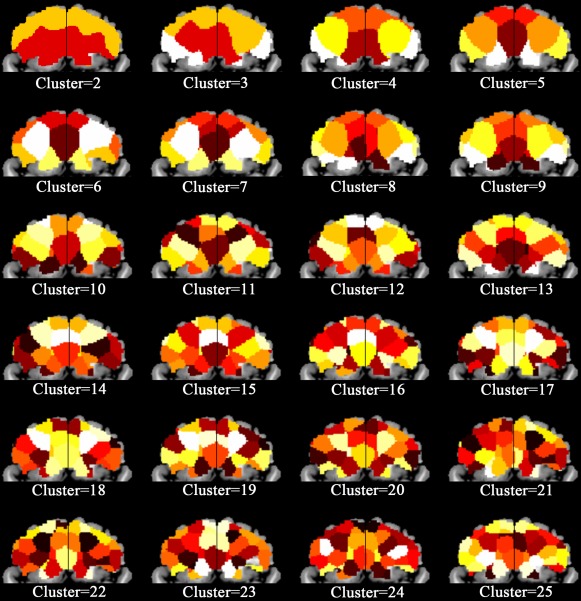
GMV covariance‐based parcellation of the human orbitofrontal cortex (OFC) of different cluster number. [Color figure can be viewed in the online issue, which is available at http://wileyonlinelibrary.com]
Figure 2.
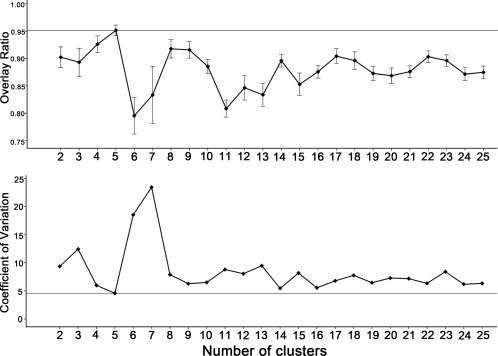
The average overlap ratios and coefficients of variation of the parcellation clusters from 2 to 25. A: demonstrates the average overlap ratios across “leave‐one‐out” sub‐datasets. A high value indicates good consistency. The straight line demonstrates the highest overlap ratio (0.95). Error bars illustrate one standard error of overlap ratios across sub‐datasets. B shows the coefficients of variation of different cluster numbers across sub‐datasets. A low value indicates less variation. The straight line demonstrates the lowest coefficient of variation (4.58). The 5‐cluster solution is shown to have the highest consistency for the OFC.
Using the five‐cluster scheme, the right OFC was parcellated into the anterior (OFCa), medial (OFCm), posterior (OFCp), intermediate (OFCi), and lateral (OFCl) subregions (Fig. 3A). The parcellation results were validated by similar analyses of the left OFC (Fig. 3A). The parcellation results of the bilateral OFCs were very similar in females and males (Fig. 3A). The centriod distribution of each OFC subregion across subject subgroups is shown in Figure 3B. The averaged MNI coordinates of the centriods of the five OFC subregions were as follows: the OFCa (left: −6, 40, −16; right: 6, 41, −13), OFCm (left: −16, 58, −10; right: 14, 57, −11), OFCp (left: −28, 39, −15; right: 28, 41, −16), OFCi (left: −42, 33, −10; right: 43, 35 −10); and OFCl (left: −15, 23, −21; right: 18, 23, −21).
Figure 3.
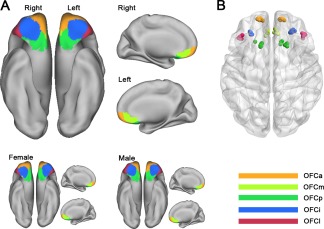
GMV covariance‐based parcellation of the human OFC. The human bilateral OFC can be reproducibly subdivided into anterior (orange), medial (yellow), posterior (green), intermediate (blue), and lateral (red) subregions. The parcellation results for females and males are remarkably similar (A). Centroid distribution (B) of the OFC subregions. Maps are displayed on a three‐dimensional brain surface using Caret software. OFC, orbitofrontal cortex; OFCa, anterior subregion of the OFC; OFCm, medial subregion of the OFC; OFCp, posterior subregion of the OFC; OFCi, intermediate subregion of the OFC; OFCl, lateral subregion of the OFC. [Color figure can be viewed in the online issue, which is available at http://wileyonlinelibrary.com]
GMV Covariance Patterns of the OFC Subregions
The whole‐brain GMV covariance patterns of each OFC subregion is displayed on the Caret PALS template. Here, we only found positive correlation under the FWE correction (P < 0.01, two tailed). We identified partly different GMV covariance patterns of the five OFC subregions with the whole brain. Brain regions covaried with OFC subregions were mainly the dorsolateral and medial prefrontal cortex, insula cortex, cingulate cortex, TP, medial temporal cortex, and amygdala (Fig. 4). To visualize the differential GMV covariance patterns of the five OFC subregions, we calculated the GMV correlation fingerprints between each of the five OFC subregions and the 14 predefined target regions (Fig. 5). The OFCa exhibited strong GMV correlation with the bilateral SFG; the OFCm showed great correlation with the bilateral ACC and MCC; the OFCp exhibited high correlation with the bilateral Amyg and TP; the OFCi had correlation with the bilateral SFG, ACC, and TP; and the OFCl showed high GMV correlation with the bilateral Insula and IFG.
Figure 4.
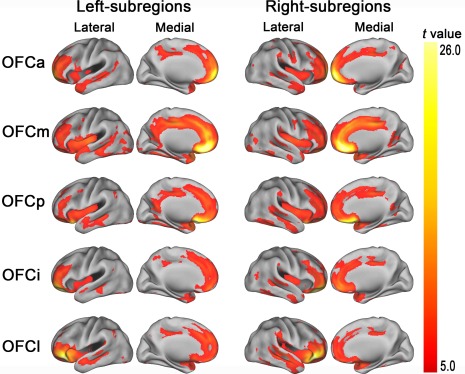
GMV covariance patterns of the bilateral five OFC subregions (P < 0.01, FWE correction, two tailed). OFC, orbitofrontal cortex; OFCa, anterior subregion of the OFC; OFCm, medial subregion of the OFC; OFCp, posterior subregion of the OFC; OFCi, intermediate subregion of the OFC; OFCl, lateral subregion of the OFC. [Color figure can be viewed in the online issue, which is available at http://wileyonlinelibrary.com]
Figure 5.
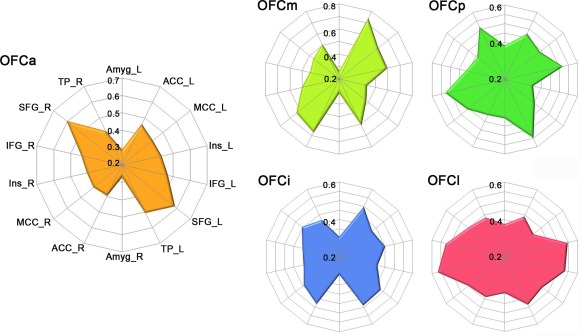
GMV correlation fingerprints of the five OFC subregions. The OFC subregions are shown in different colors. Abbreviations: Amyg, amygdala; ACC, anterior cingulate cortex; IFG, inferior frontal gyri; L, left; MCC, mid‐cingulate cortex; OFC, orbitofrontal cortex; R, right; SFG, superior frontal gyri; TP, temporal pole. [Color figure can be viewed in the online issue, which is available at http://wileyonlinelibrary.com]
GMV Correlation Differences Across OFC Subregions
A Williams t‐test was used to compare differences in GMV correlation between every two OFC subregions and each target region. The GMV correlation coefficient differences (P < 0.05, two tailed, Bonferroni‐corrected) across the five OFC subregions are shown in Figure 6.
Figure 6.
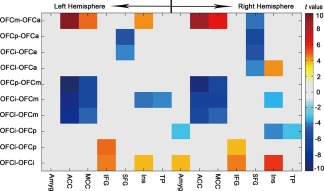
A matrix map exhibiting group differences in GMV covariance between the OFC subregions and the 14 target regions. The x‐axis denotes the 14 target regions and the y‐axis demonstrates each pair of the OFC subregions. Abbreviations: Amyg, amygdala; ACC, anterior cingulate cortex; IFG, inferior frontal gyri; MCC, mid‐cingulate cortex; OFC, orbitofrontal cortex; SFG, superior frontal gyri; TP, temporal pole. [Color figure can be viewed in the online issue, which is available at http://wileyonlinelibrary.com]
Compared with OFCa, OFCm showed stronger GMV correlation with the left Ins and bilateral ACC and MCC and weaker GMV correlation with the right SFG; OFCp and OFCi had weaker GMV correlation with the bilateral SFG; OFCl exhibited greater GMV correlation with the right Ins and weaker GMV correlation with the right SFG. Compared to OFCm, OFCi, OFCp, and OFCl had weaker GMV correlation with the bilateral ACC and MCC. Compared to OFCp, OFCi exhibited weaker GMV correlation with the right Amyg, Ins, and TP; OFCl had stronger GMV correlation with the bilateral IFG. Compared to OFCi, OFCl had stronger GMV correlation with the right Amyg and bilateral IFG and Ins.
Laterality Differences in GMV Correlation of the OFC Subregions
We compared the interhemispheric differences in GMV correlation coefficients between the OFC subregions and the 14 target regions and found that most of the OFC subregions exhibited symmetric GMV correlation patterns between the left and right hemispheres (Bonferroni correction, P < 0.05) (Fig. 7). Specifically, the right OFCl exhibited a stronger GMV correlation with the right IFG compared to the left OFCl (Fig. 7).
Figure 7.
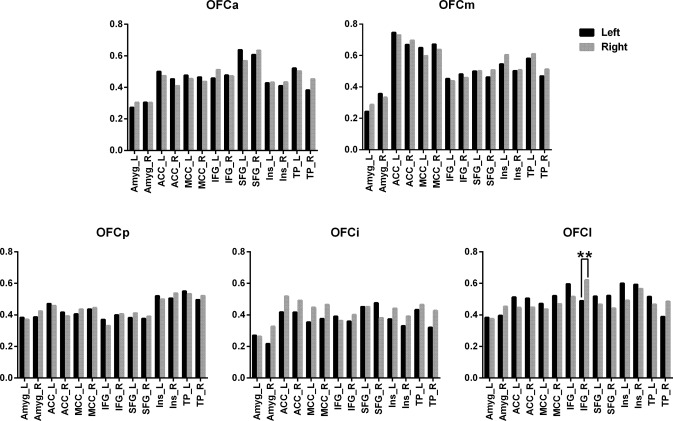
Laterality differences (P < 0.05, Bonferroni‐corrected) in GMV correlation coefficients between each OFC subregion and the 14 target regions. Abbreviations: Amyg, amygdala; ACC, anterior cingulate cortex; IFG, inferior frontal gyri; MCC, mid‐cingulate cortex; OFC, orbitofrontal cortex; SFG, superior frontal gyri; TP, temporal pole.
Sex Differences in GMV Correlation of the OFC Subregions
We also compared sex differences in GMV covariance coefficients between the OFC subregions and the 14 target regions and did not find any significant differences (Bonferroni correction, P < 0.05) between male and female individuals (Fig. 8).
Figure 8.
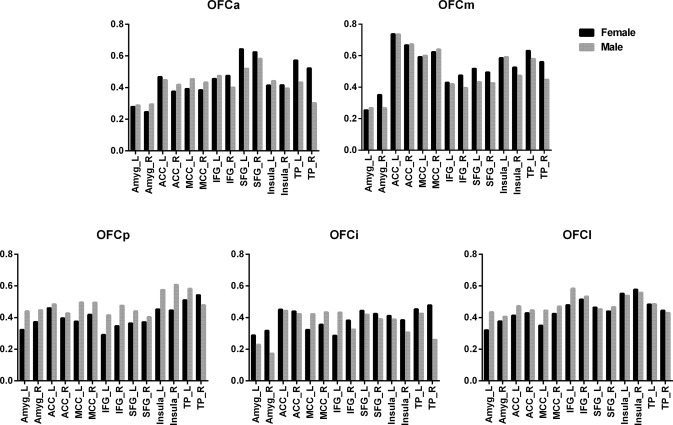
Sex differences (P < 0.05, Bonferroni‐uncorrected) in GMV correlation coefficients between each OFC subregion and the 14 target regions. Abbreviations: Amyg, amygdala; ACC, anterior cingulate cortex; IFG, inferior frontal gyri; MCC, mid‐cingulate cortex; OFC, orbitofrontal cortex; SFG, superior frontal gyri; TP, temporal pole.
DISCUSSION
To the best of our knowledge, this is the first study to parcellate the human OFC based on GM structural covariance. The results reveal that the human OFC can be parcellated in vivo into five subregions that approximately correspond to the cytoarchitectural areas in both human and monkey [Carmichael and Price, 1994; Mackey and Petrides, 2010; Ongur et al., 2003; Petrides and Pandya, 1994]. Each OFC subregion exhibited unique GMV covariance patterns that reflect anatomical and functional connections. We also found laterality difference in the GMV correlation patterns of the OFCl. These findings may improve our understanding of the human OFC at subregional levels.
The structural complexity and functional diversity of the human OFC suggest the existence of subregions. Investigation of this complex and enigmatic brain region at subregional levels may improve our understanding of the human OFC. However, commonly used DTI‐ and fMRI‐based parcellation methods cannot yield convincing results because the OFC is always subject to imaging artefacts when the EPI sequence is used. Here, we parcellated the human OFC based on GMV covariance that emerged from high‐resolution, artefact‐free structural images. Voxel‐wise GMV covariance quantifies the extent to which GMVs covary among different brain regions across individuals. Although the biological meaning of this GMV covariance remains controversial, it appears to reflect developmental coordination or synchronized maturation between brain areas [Alexander‐Bloch et al., 2013a]. Structural covariance networks exhibit strong correspondence with functional networks that are derived from rsFC. More importantly, the parcellation results of the human insula based on GMV covariance are remarkably similar to those derived from rsFC [Kelly et al., 2012]. These findings prompted us to parcellate the human OFC based on GMV covariance patterns.
The human OFC has also been parcellated into five subregions based on cytoarchitectural analysis (areas 10, 11, 13, 14, and 47/12); this parcellation scheme is consistent with that of the monkey OFC despite size differences in subregions across species [Carmichael and Price, 1994; Petrides and Pandya, 1994]. Recently, based on cytoarchitectural characteristics, the human OFC has been subdivided into multiple smaller subregions [Mackey and Petrides, 2010; Ongur et al., 2003]. However, these cytoarchitecture‐based subdivisions from different studies are not in perfect agreement. Although there is not a direct one‐to‐one correspondence between our scheme and any of the previously proposed cytoarchitectural schemes, we really found certain correspondence between ours and previous schemes. Specifically, the OFCp situated on the posterior part of the gyrus rectus and medial orbital gyrus as well as the posterior orbital gyrus, which appears to correspond to areas 14c, 14r, and 13 in Mackey and Petrides [2010]. The OFCa is situated at the frontal pole and extends posteriorly onto the anterior parts of the gyrus rectus and medial orbital gyrus, corresponding to area 10 and 11 m in Mackey and Petrides [2010]. The OFCm corresponds to area 14 m in Mackey and Petrides [2010]. The OFCi and OFCl corresponds to areas 11 and 47/12, respectively [Mackey and Petrides, 2010].
Compared with the standard practice of describing the location of functional activity in terms of its morphological position and then relating this to the cortical architecture, our parcellation may help us to report activation clusters in specific OFC subregions which contain both cytoarchitectonic and structural covariance information. Our study may also help us to get a clearer idea of how GMV covariance patterns correspond to cytoarchitectonic mapping. Moreover, our study may provide a research frame to use GMV covariance information to parcellate brain regions that cannot be reliably parcellated by DTI and fMRI methods due to signal dropout and geometric distortion. Finally, the OFC subregions derived from our parcellation may be used as seed regions to investigate GMV covariance or connectivity changes in disorders with the OFC impairment at the level of subregions.
In this study, we found that the OFC covaried mainly with the dorsolateral and medial prefrontal cortex, insula cortex, cingulate cortex, TP, medial temporal cortex, and amygdala. This is consistent with previous tracing studies in monkeys that showed anatomical connections between the OFC and the dorsolateral and medial prefrontal cortex [Barbas and Pandya, 1989; Cavada et al., 2000], insula [Mesulam and Mufson, 1982a,b; Mufson and Mesulam, 1982], medial temporal lobe [Carmichael and Price, 1995; Ongur and Price, 2000], and amygdala [Carmichael and Price, 1995; Ghashghaei et al., 2007]. The GMV covariance pattern of the OFC is also partially consistent with the rsFC [Kahnt et al., 2012] and coactivation [Zald et al., 2014] patterns of the region. Although the biological meaning of the GM structural covariance remains unclear [Alexander‐Bloch et al., 2013a], the overlap of patterns of structural covariance, anatomical connection, functional connectivity, and coactivation may support the hypothesis that regions that covary in terms of GM appear to have synchronized maturation [Alexander‐Bloch et al., 2013a,b] or may be part of the same functional network [Seeley et al., 2009; Zielinski et al., 2010].
We identified the specific GMV correlation pattern for each OFC subregion in this article. The OFCa showed GMV correlations primarily with the SFG and TP which are involved in the integration of complex cognitive processing [Burgess et al., 2007]. The OFCm exhibit a stronger GMV correlation with the ACC, which is consistent with previous studies that showed anatomical [Ongur and Price, 2000] and functional connectivity [Yu, 2011] between these areas. Neuroimaging and lesion studies have both suggested that these brain regions are involved in internally focused tasks, such as contemplating the future and processing information concerning rewards [Amodio and Frith, 2006; Rolls, 2004]. The OFCp, approximately corresponding to area 13, exhibited GMV correlation with multiple regions with similar strengths, supporting its role as a transition region within the OFC. Besides, the OFCp showed the strongest GMV correlation with Amyg and TP, which is consistent with a previously reported anatomical connection [Olson et al., 2007; Price et al., 1991; Rolls, 2004] and functional association [Banks et al., 2007; Ochsner et al., 2004] between these regions. The OFCl exhibited greater GMV correlation with the IFG, Ins, and TP, which are important nodes of salience network [He et al., 2013; Seeley et al., 2007].
We demonstrate in this article for the first time that whether there are laterality and sex differences in GMV correlation of different subregions of the human OFC. Overall, sex exerted little influence on GMV correlation of OFC subregions reflecting the mimic inter‐regional GMV correlations in the male and female adults. Although most of the OFC subregions exhibit symmetric GMV correlation patterns between the left and right hemispheres, the right OFCl showed a stronger GMV correlation with the right inferior frontal gyrus than the left OFCl. Considering the overall rightward volumetric asymmetry in the human OFC [Raz et al., 1997], our finding suggests a specific laterality effect on GMV correlation of the OFC subregion. The biological significance of the laterality effect requires further investigation.
CONCLUSION
On the basis of GMV covariance patterns, we parcellated the human OFC into five subregions that approximately correspond to cytoarchitectural areas. The in vivo maps for each OFC subregion may guide future subregion‐level studies of the OFC. We also found specific GMV covariance patterns and possible laterality differences in these patterns, which may improve understanding of the functionality of each OFC subregion.
REFERENCES
- Alexander‐Bloch A, Giedd JN, Bullmore E (2013a): Imaging structural co‐variance between human brain regions. Nat Rev Neurosci 14:322–336. [DOI] [PMC free article] [PubMed] [Google Scholar]
- Alexander‐Bloch A, Raznahan A, Bullmore E, Giedd J (2013b): The convergence of maturational change and structural covariance in human cortical networks. J Neurosci 33:2889–2899. [DOI] [PMC free article] [PubMed] [Google Scholar]
- Amodio DM, Frith CD (2006): Meeting of minds: The medial frontal cortex and social cognition. Nat Rev Neurosci 7:268–277. [DOI] [PubMed] [Google Scholar]
- Ashburner J (2007): A fast diffeomorphic image registration algorithm. Neuroimage 38:95–113. [DOI] [PubMed] [Google Scholar]
- Banks SJ, Eddy KT, Angstadt M, Nathan PJ, Phan KL (2007): Amygdala‐frontal connectivity during emotion regulation. Soc Cogn Affect Neurosci 2:303–312. [DOI] [PMC free article] [PubMed] [Google Scholar]
- Barbas H (2007): Specialized elements of orbitofrontal cortex in primates. Ann NY Acad Sci 1121:10–32. [DOI] [PubMed] [Google Scholar]
- Barbas H, Pandya DN (1989): Architecture and intrinsic connections of the prefrontal cortex in the rhesus monkey. J Comp Neurol 286:353–375. [DOI] [PubMed] [Google Scholar]
- Brodmann K (1909): Vergleichende Lokalisationslehre der Großhimrinde in ihren Prinzipien dargestellt auf Grund des Zellenbaues. Leipzig, Germany: Barth. [Google Scholar]
- Brodmann K, Garey LJ (2007): Brodmann's: Localisation in the Cerebral Cortex. New York: Springer. [Google Scholar]
- Burgess PW, Gilbert SJ, Dumontheil I (2007): Function and localization within rostral prefrontal cortex (area 10). Philos Trans R Soc Lond B Biol Sci 362:887–899. [DOI] [PMC free article] [PubMed] [Google Scholar]
- Carmichael ST, Price JL (1994): Architectonic subdivision of the orbital and medial prefrontal cortex in the macaque monkey. J Comp Neurol 346:366–402. [DOI] [PubMed] [Google Scholar]
- Carmichael ST, Price JL (1995): Limbic connections of the orbital and medial prefrontal cortex in macaque monkeys. J Comp Neurol 363:615–641. [DOI] [PubMed] [Google Scholar]
- Carmichael ST, Price JL (1996): Connectional networks within the orbital and medial prefrontal cortex of macaque monkeys. J Comp Neurol 371:179–207. [DOI] [PubMed] [Google Scholar]
- Cavada C, Company T, Tejedor J, Cruz‐Rizzolo RJ, Reinoso‐Suarez F (2000): The anatomical connections of the macaque monkey orbitofrontal cortex. A review. Cereb Cortex 10:220–242. [DOI] [PubMed] [Google Scholar]
- Crespo‐Facorro B, Kim J, Andreasen NC, O'Leary DS, Magnotta V (2000): Regional frontal abnormalities in schizophrenia: A quantitative gray matter volume and cortical surface size study. Biol Psychiatry 48:110–119. [DOI] [PubMed] [Google Scholar]
- Devlin JT, Russell RP, Davis MH, Price CJ, Wilson J, Moss HE, Matthews PM, Tyler LK (2000): Susceptibility‐induced loss of signal: Comparing PET and fMRI on a semantic task. Neuroimage 11(Pt 1):589–600. [DOI] [PubMed] [Google Scholar]
- Ghashghaei HT, Hilgetag CC, Barbas H (2007): Sequence of information processing for emotions based on the anatomic dialogue between prefrontal cortex and amygdala. Neuroimage 34:905–923. [DOI] [PMC free article] [PubMed] [Google Scholar]
- He X, Qin W, Liu Y, Zhang X, Duan Y, Song J, Li K, Jiang T, Yu C (2013): Age‐related decrease in functional connectivity of the right fronto‐insular cortex with the central executive and default‐mode networks in adults from young to middle age. Neurosci Lett 544:74–79. [DOI] [PubMed] [Google Scholar]
- Howell DC (2010): Statistical Methods for Psychology, 7th ed. Belmont, CA: Wadsworth.
- Johansen‐Berg H, Behrens TE, Robson MD, Drobnjak I, Rushworth MF, Brady JM, Smith SM, Higham DJ, Matthews PM (2004): Changes in connectivity profiles define functionally distinct regions in human medial frontal cortex. Proc Natl Acad Sci USA 101:13335–13340. [DOI] [PMC free article] [PubMed] [Google Scholar]
- Kahnt T, Chang LJ, Park SQ, Heinzle J, Haynes JD (2012): Connectivity‐based parcellation of the human orbitofrontal cortex. J Neurosci 32:6240–6250. [DOI] [PMC free article] [PubMed] [Google Scholar]
- Kelly C, Toro R, Di Martino A, Cox CL, Bellec P, Castellanos FX, Milham MP (2012): A convergent functional architecture of the insula emerges across imaging modalities. Neuroimage 61:1129–1142. [DOI] [PMC free article] [PubMed] [Google Scholar]
- Kringelbach ML (2005): The human orbitofrontal cortex: Linking reward to hedonic experience. Nat Rev Neurosci 6:691–702. [DOI] [PubMed] [Google Scholar]
- Kringelbach ML, Rolls ET (2004): The functional neuroanatomy of the human orbitofrontal cortex: Evidence from neuroimaging and neuropsychology. Prog Neurobiol 72:341–372. [DOI] [PubMed] [Google Scholar]
- Lacerda AL, Keshavan MS, Hardan AY, Yorbik O, Brambilla P, Sassi RB, Nicoletti M, Mallinger AG, Frank E, Kupfer DJ, JC Soares (2004): Anatomic evaluation of the orbitofrontal cortex in major depressive disorder. Biol Psychiatry 55:353–358. [DOI] [PubMed] [Google Scholar]
- Mackey S, Petrides M (2010): Quantitative demonstration of comparable architectonic areas within the ventromedial and lateral orbital frontal cortex in the human and the macaque monkey brains. Eur J Neurosci 32:1940–1950. [DOI] [PubMed] [Google Scholar]
- Mechelli A, Friston KJ, Frackowiak RS, Price CJ (2005): Structural covariance in the human cortex. J Neurosci 25:8303–8310. [DOI] [PMC free article] [PubMed] [Google Scholar]
- Merboldt KD, Fransson P, Bruhn H, Frahm J (2001): Functional MRI of the human amygdala? Neuroimage 14:253–257. [DOI] [PubMed] [Google Scholar]
- Mesulam MM, Mufson EJ (1982a): Insula of the old world monkey. I. Architectonics in the insulo‐orbito‐temporal component of the paralimbic brain. J Comp Neurol 212:1–22. [DOI] [PubMed] [Google Scholar]
- Mesulam MM, Mufson EJ (1982b): Insula of the old world monkey. III: Efferent cortical output and comments on function. J Comp Neurol 212:38–52. [DOI] [PubMed] [Google Scholar]
- Mufson EJ, Mesulam MM (1982): Insula of the old world monkey. II: Afferent cortical input and comments on the claustrum. J Comp Neurol 212:23–37. [DOI] [PubMed] [Google Scholar]
- Ochsner KN, Ray RD, Cooper JC, Robertson ER, Chopra S, Gabrieli JD, Gross JJ (2004): For better or for worse: Neural systems supporting the cognitive down‐ and up‐regulation of negative emotion. Neuroimage 23:483–499. [DOI] [PubMed] [Google Scholar]
- Oldfield RC (1971): The assessment and analysis of handedness: The Edinburgh inventory. Neuropsychologia 9:97–113. [DOI] [PubMed] [Google Scholar]
- Olson IR, Plotzker A, Ezzyat Y (2007): The Enigmatic temporal pole: A review of findings on social and emotional processing. Brain 130(Pt 7):1718–1731. [DOI] [PubMed] [Google Scholar]
- Ongur D, Price JL (2000): The organization of networks within the orbital and medial prefrontal cortex of rats, monkeys and humans. Cereb Cortex 10:206–219. [DOI] [PubMed] [Google Scholar]
- Ongur D, Ferry AT, Price JL (2003): Architectonic subdivision of the human orbital and medial prefrontal cortex. J Comp Neurol 460:425–449. [DOI] [PubMed] [Google Scholar]
- Petrides M, Pandya DN (1994): Comparative architectonic analysis of the human and the macaque frontal cortex[J]. Handbook Neuropsychol 9:17–58. [Google Scholar]
- Price J, Carmichael S, Carnes K, Clugnet M, Kuroda M, Ray J (1991): Olfactory input to the prefrontal cortex. Olfaction: A model system for computational neuroscience; Cambridge, Mass: MIT Press. pp 101–120. [Google Scholar]
- Price JL (2007): Definition of the orbital cortex in relation to specific connections with limbic and visceral structures and other cortical regions. Ann NY Acad Sci 1121:54–71. [DOI] [PubMed] [Google Scholar]
- Raz N, Gunning FM, Head D, Dupuis JH, McQuain J, Briggs SD, Loken WJ, Thornton AE, Acker JD (1997): Selective aging of the human cerebral cortex observed in vivo: Differential vulnerability of the prefrontal gray matter. Cereb Cortex 7:268–282. [DOI] [PubMed] [Google Scholar]
- Rolls ET (2004): The functions of the orbitofrontal cortex. Brain Cogn 55:11–29. [DOI] [PubMed] [Google Scholar]
- Rolls ET, Grabenhorst F (2008): The orbitofrontal cortex and beyond: From affect to decision‐making. Prog Neurobiol 86:216–244. [DOI] [PubMed] [Google Scholar]
- Seeley W, Menon V, Schatzberg AF, Keller J, Glover GH, Kenna H, Reiss AL, Greicius MD (2007): Dissociable intrinsic connectivity networks for salience processing and executive control. J Neurosci 27:2349–2356. [DOI] [PMC free article] [PubMed] [Google Scholar]
- Seeley W, Crawford RK, Zhou J, Miller BL, Greicius MD (2009): Neurodegenerative diseases target large‐scale human brain networks. Neuron 62:42–52. [DOI] [PMC free article] [PubMed] [Google Scholar]
- Sladky R, Hoflich A, Kublbock M, Kraus C, Baldinger P, Moser E, Lanzenberger R, Windischberger C: Disrupted effective connectivity between the amygdala and orbitofrontal cortex in social anxiety disorder during emotion discrimination revealed by dynamic causal modeling for fmri (in press). [DOI] [PMC free article] [PubMed]
- Taylor PA, Gohel S, Di X, Walter M, Biswal BB (2012): Functional covariance networks: Obtaining resting‐state networks from intersubject variability. Brain Connect 2:203–217. [DOI] [PMC free article] [PubMed] [Google Scholar]
- Tzourio‐Mazoyer N, Landeau B, Papathanassiou D, Crivello F, Etard O, Delcroix N, Mazoyer B, Joliot M (2002): Automated anatomical labeling of activations in SPM using a macroscopic anatomical parcellation of the MNI MRI single‐subject brain. Neuroimage 15:273–289. [DOI] [PubMed] [Google Scholar]
- van den Heuvel OA, Remijnse PL, Mataix‐Cols D, Vrenken H, Groenewegen HJ, Uylings HB, van Balkom AJ, Veltman DJ (2009): The major symptom dimensions of obsessive‐compulsive disorder are mediated by partially distinct neural systems. Brain 132(Pt 4):853–868. [DOI] [PubMed] [Google Scholar]
- Wang J, Ju L, Wang X (2009): An edge‐weighted centroidal Voronoi tessellation model for image segmentation. IEEE Trans Image Process 18:1844–1858. [DOI] [PubMed] [Google Scholar]
- Williams EJ (1959): The comparison of regression variables. J R Stat Soc (Ser B) 21:396–399. [Google Scholar]
- Yu CZY, Liu Y, Jiang T, Dong H, Zhang Y, Walter M (2011): Functional segregation of the human cingulate cortex is confirmed by functional connectivity based neuroanatomical parcellation. Neuroimage 54:2571–2581. [DOI] [PubMed] [Google Scholar]
- Zald DH, McHugo M, Ray KL, Glahn DC, Eickhoff SB, Laird AR (2014): Meta‐analytic connectivity modeling reveals differential functional connectivity of the medial and lateral orbitofrontal cortex. Cereb Cortex 24:232–248. [DOI] [PMC free article] [PubMed] [Google Scholar]
- Zielinski BA, Gennatas ED, Zhou J, Seeley WW (2010): Network‐level structural covariance in the developing brain. Proc Natl Acad Sci USA 107:18191–18196. [DOI] [PMC free article] [PubMed] [Google Scholar]


