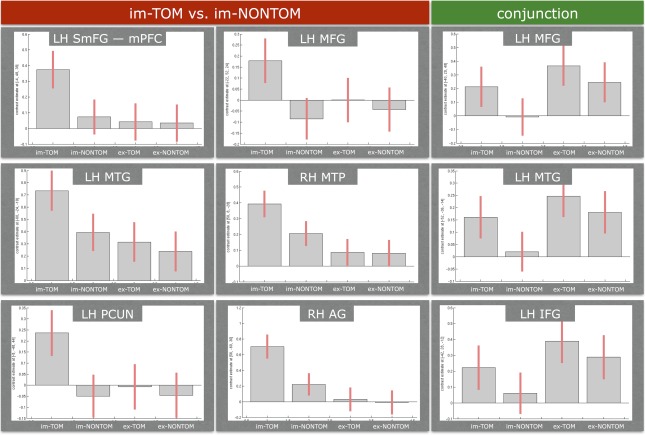
Figure 6.

Bar plots of BOLD signal changes (contrast estimates) at the peak voxel of each cluster for implicit false belief processing and the conjunction of implicit and explicit contrasts. Abbreviations: RH, right hemisphere; LH, left hemisphere; AG, angular gyrus; SmFG, superior medial frontal gyrus; mPFC, medial prefrontal cortex; MTG, middle temporal gyrus; MTP, middle temporal pole; MFG, middle frontal gyrus; PCUN, precuneus. Please note that we have placed the plots for precuneus, AG and IFG next to each other for illustration reasons and with absolutely no intention of denoting that they are overlapping regions. For explicit and implicit contrasts: individual voxel threshold of P < 0.001 and cluster extend threshold of 48 voxels (Monte Carlo corrected). For the conjunction: individual voxel threshold of P < 0.05 and cluster extend threshold of 120 voxels (Monte Carlo corrected). The error bars represent 90% confidence intervals. [Color figure can be viewed in the online issue, which is available at http://wileyonlinelibrary.com.]
