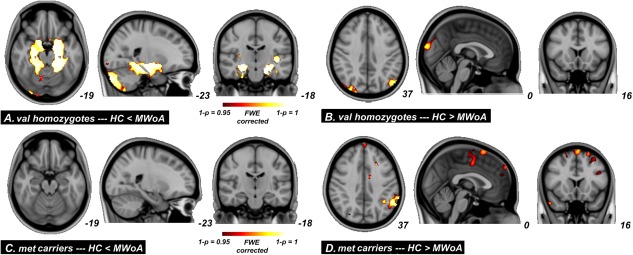
Figure 3.

Significant between group differences from whole‐brain GM volume comparisons conducted on healthy versus migraine in val homozygotes and met carriers subjects. [Color figure can be viewed in the online issue, which is available at http://wileyonlinelibrary.com.]
