
Figure 4.
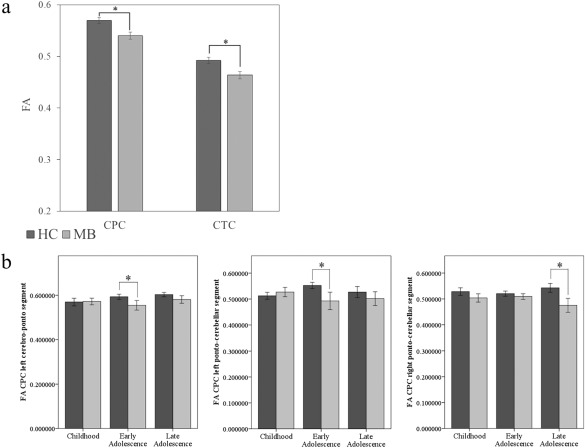
Cerebrocerebellar pathway microstructure as a function of group and age tertile. Panel a: main effect of group for FA of the CPC and CTC pathways (bars represent estimated marginal means; error bars represent the standard error of the mean). HC group = dark grey bars, MB group = light grey bars. Panel b: FA of the CPC pathway for each group (HC = dark grey bars, MB = light grey bars) across age tertiles, based on significant group × age tertile × side × segment interaction. From left to right: FA of the left cerebro‐ponto segment, FA of the left pontocerebellar segment, and FA of the right pontocerebellar segment. Error bars reflect standard error.