
Figure 3.
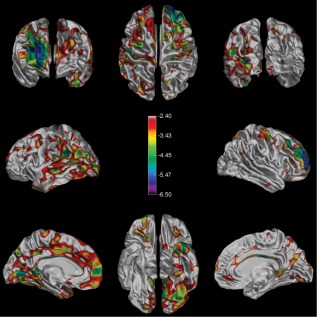
Significant differences in cortical MTR between the SP and NC groups. The color bar shows the false‐discovery‐rate‐corrected t‐statistics, such that any highlighted area on the surface represents a statistically significant decrease in MTR between groups. The RR cohort showed no such significant differences. [Color figure can be viewed in the online issue, which is available at http://wileyonlinelibrary.com.]