
Figure 6.
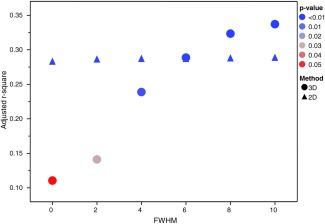
Adjusted r 2 values at each of the full‐width‐at‐half‐maximum (FWHM) blurring kernel sizes for a 2D and a 3D analysis looking for group differences in the cGM MTR values. The r 2 of the ANOVA reveals how much of the variance in cGM MTR values is explained by the three groups (NC, RR, and SP) (higher r 2 means the groups are better separated), while the color of each datapoint represents the associated P value. [Color figure can be viewed in the online issue, which is available at http://wileyonlinelibrary.com.]