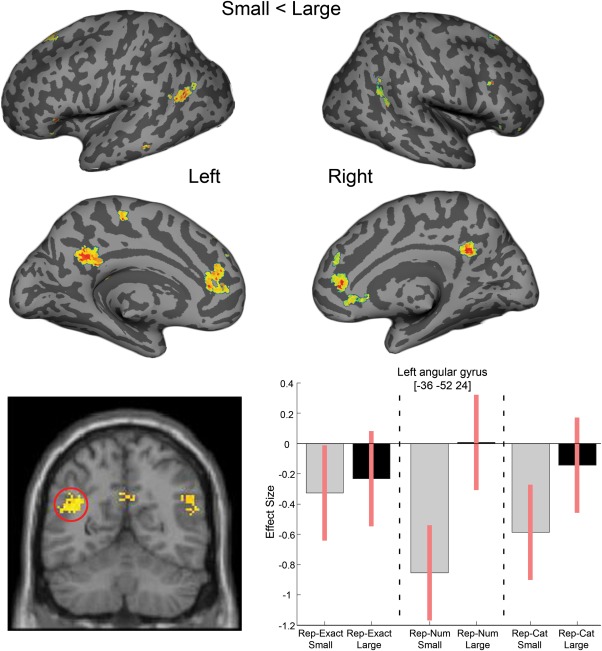
Figure 2.

Brain regions showing reduced activation for pairs of small numerosities, compared with pairs of large numerosities. Top: Whole brain SPM contrasts were overlaid on a surface based representation of the MNI canonical brain using the SPM SurfRend Toolbox (written by I. Kahn; http://spmsurfrend.sourceforge.net). Bottom: Contrast estimates and 90% confidence intervals for the simple effects in the peak voxel of the left angular gyrus adaptation.
