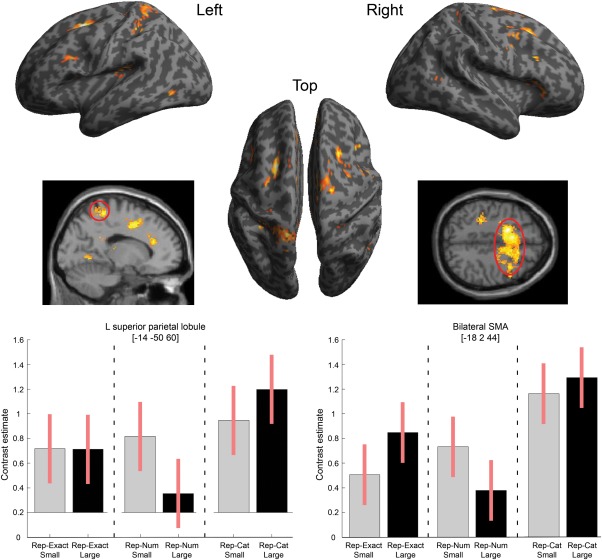
Figure 3.

Regions showing reduced activation (adaptation) for repetitions of the same numerosity, compared with different numerosities from the same category for both small and large numbers of items. Top: Results overlaid on SPM inflated surface render. Bottom: Plots of contrast estimates and 90% confidence intervals for the simple effects conditions in the peak voxel of the left superior parietal gyrus (left graph) and the peak voxel of the large bilateral superior frontal gyrus cluster (right graph).
