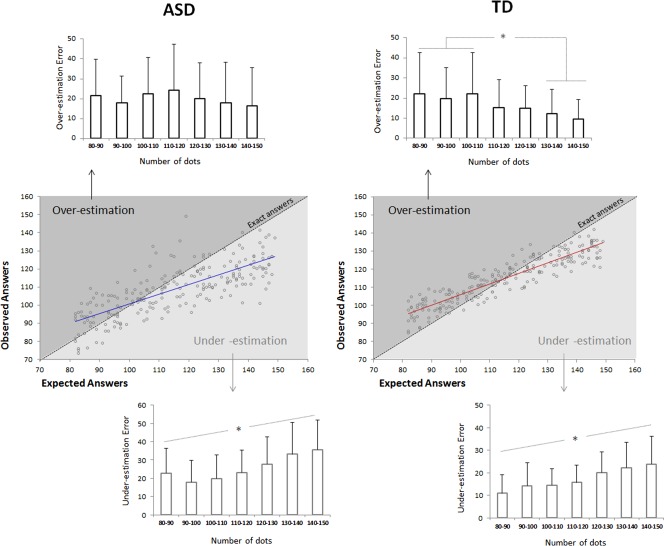
Figure 3.

Behavioural results: Strategy used to process numerosity. The middle graphs correspond to the plot of the mean of the observed answers as a function of the expected answers for each stimulus, separately for each group. The dotted black line is the exact answers function whereas the actual answers were represented in the plain blue (for ASD) and red (for TD) lines. According to this, the area above the black line contains all the stimuli that lead to over‐estimation whereas the dots below this line are the stimuli followed by under‐estimation. These plots showed a global numerical size effect on the strategy used to process patterns of dots in both group and revealed that this effect is stronger in ASD participants. The top and bottom graphs specify respectively the magnitude of Over‐ and Under‐estimation errors according to the number of dots. ASD and TD participants tended to make larger underestimation error for large than small numerosities. The reverse result was only observed in the TD group: TD participant tended to make larger overestimation error for small than large numerosity.
