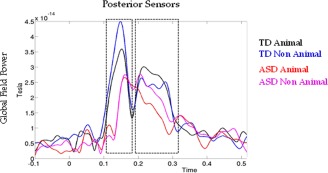
Figure 7.

Global field power (GFP) of animal and nonanimal shape stimuli in ASD and TD groups, calculated for posterior sensors. The peak observed in the GFP revealed that differences between the two types of stimuli appear around 120 ms (first rectangular shape, NA>A) and continue until 290 ms (second rectangular shape, A>NA) in TD participants. In ASD participants, GFP differences are observed only in the second rectangular shape (NA>A).
