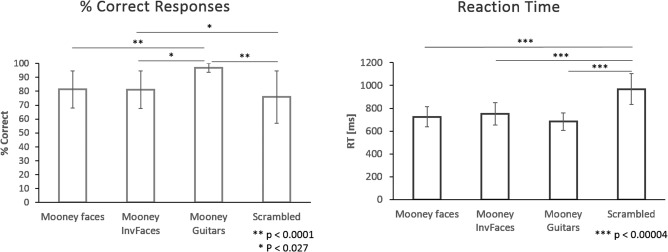
Figure 3.

Behavioral results. Left panel: bar plot showing the behavioral results per condition in terms of the discrimination rate. Significantly different comparisons are highlighted in the graph. Note that subject's best rate level is for guitars. Right panel: a bar plot representing the reaction time per condition and the statistically significant differences between them. Scrambled conditions lead to slower responses than all the other stimuli.
