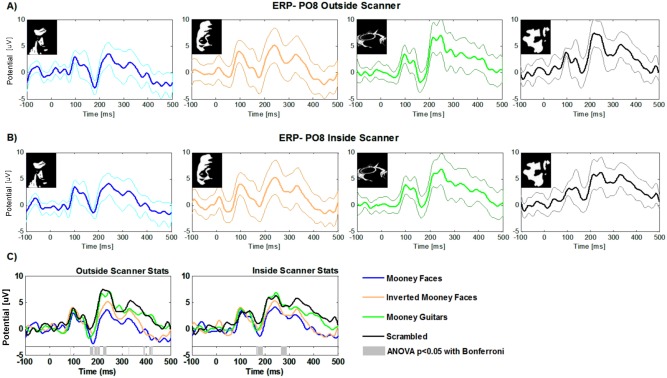
Figure 4.

Group average ERPs for EEG data acquired outside (A) and inside the scanner (B). Separate plots are shown for each condition for the PO8 electrode. Bold lines represent the group average and thicker lines the respective standard deviations. (C): Superimposed group average ERPs. Different colours represent ERPs for the PO8 channel for the different stimulus categories. Gray bars at the bottom show the time‐points where differences are statistically significant as revealed by ANOVA with bonferroni correction (P < 0.05).
