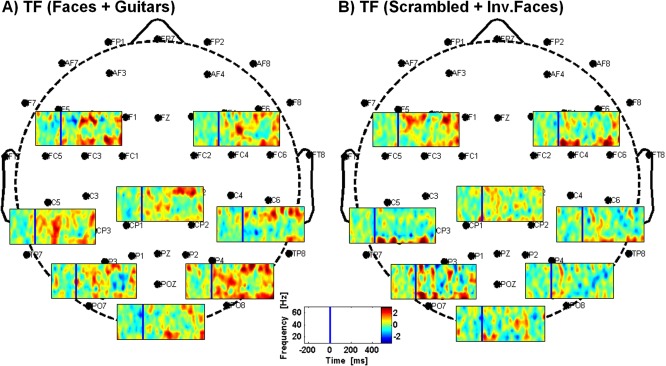
Figure 6.

Time–frequency results obtained over different clusters of channels (occipital, parietal, temporal, frontal, and those left and right). (A) Time–frequency results for the faces + guitars condition; (B) Time‐frequency results for the scrambled + inverted faces condition. Colorscale means normalized units (data normalized for the time preceding stimuli presentation) and the blue line marks the stimuli onset.
