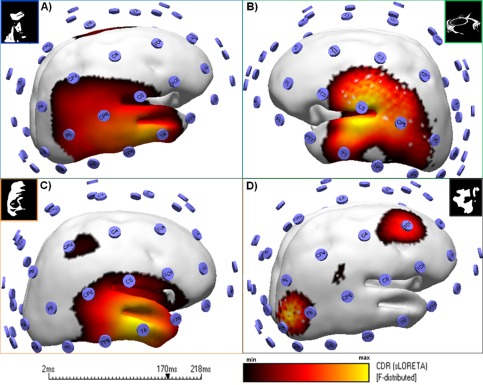
Figure 7.

Categorical perception leads to a pattern that is distinct from perception of random (scrambled) patterns. Source localization of group average ERPs reveals sources of activity at visual ventral regions. Results are shown for the N170 latency point. Colour codes correspond to the range of min and max CDR distribution values based in sLORETA. Right hemisphere dominates for the faces (F‐distributed (min–max): 5.2–6.7), inverted faces (F‐distributed 3.9–5.6) and scrambled condition (F‐distributed 5.0–7.0) while left temporal regions appear for the guitars (F‐distributed 3.3–4.2). Note that all object conditions (A–C) have a similar infero‐temporal pattern that differed from the one evoked by scrambled conditions (D). A display threshold of 75% of the CSD was applied and the sources are shown for the hemisphere that revealed higher activity. [Color figure can be viewed in the online issue, which is available at http://wileyonlinelibrary.com.]
